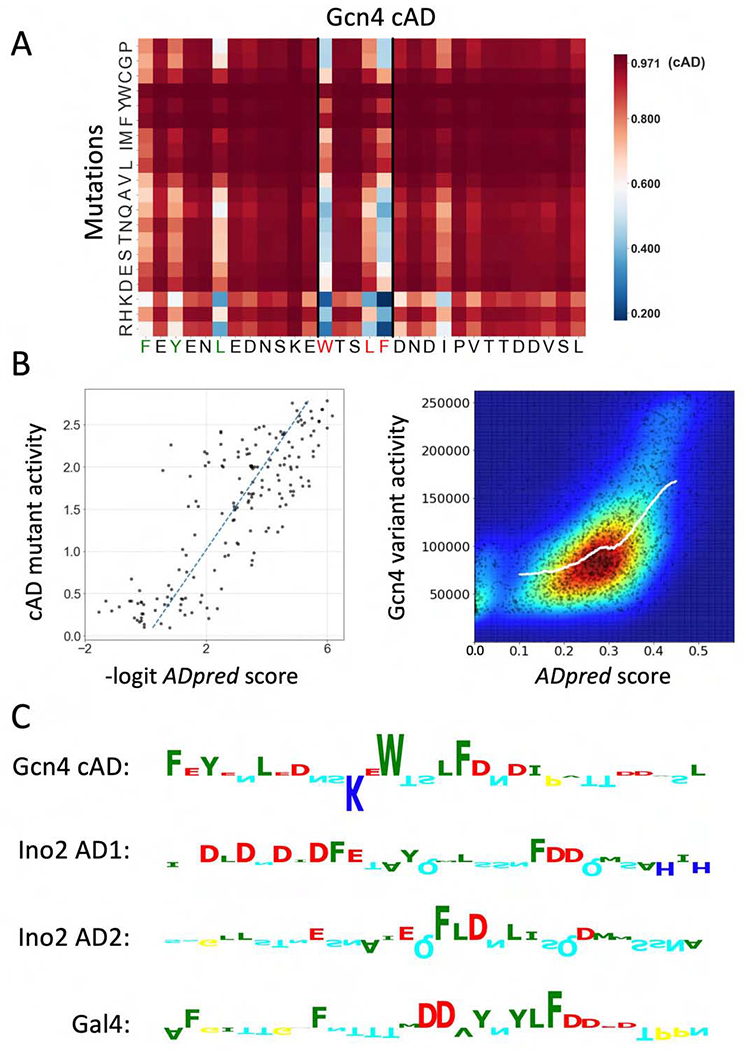
Figure 4.

Performance of ADpred on yeast activators. A) ADpred predictions for all possible single amino acid mutations of the Gcn4 central AD (cAD). An increase in ADpred score is darker red, decreases are lighter red or blue. Wild type cAD ADpred score is indicated in the colorbar. Residues important for Gcn4 function identified in prior work are colored red and green in the Gcn4 sequence below the heat map. B) (Left) The AD activity of cAD derivatives measured in (Warfield et al., 2014) shows a high correlation with ADpred predictions (R=0.82). ADpred probabilities were transformed from (0,1) to (−∞,∞) by the logit function. (Right) Comparison of ADpred predictions with a large set of yeast Gcn4 derivatives (Staller et al., 2018). Experimental data plotted as raw activity values measured under amino acid starvation conditions. Colors represent the density of points from low density in blue to high density in red. The white line shows a K nearest neighbor regression analysis (where Y is predicted by local interpolation of values from the K nearest neighbors on X, using kNeighborsRegressor function from scikit-learn package) (R=0.57). C) Predicted importance of individual residues for ADpred scores identified using the Integrated Gradients algorithm (Ancona et al., 2018; Sundararajan et al., 2017). Residue contributions in four selected yeast ADs are shown as sequence logos (positive upwards, negative downwards) Residue colors are the same as in Fig 2B. See Figs S2, S3.
