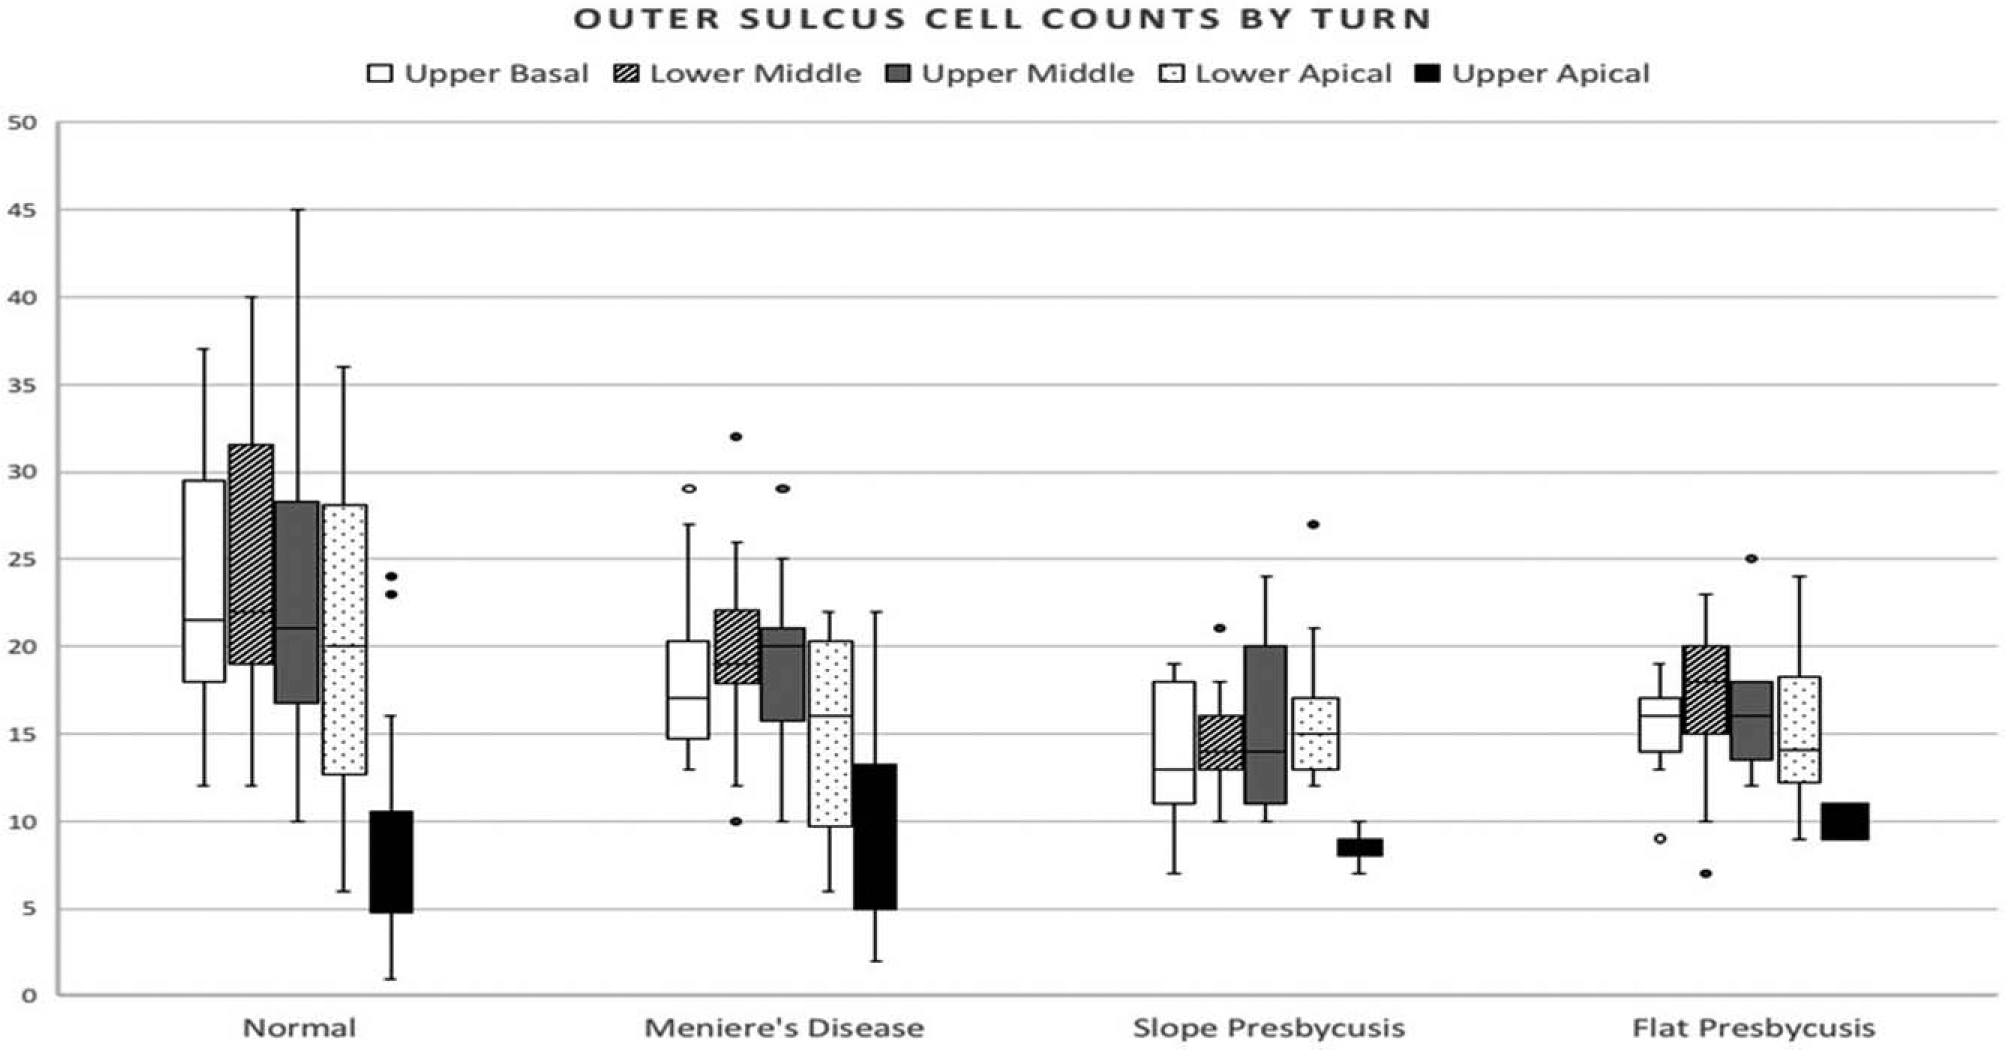
FIG. 4.

Outer sulcus cell counts for each cochlear turn from four different temporal bone types. Normal n = 10, Menière’s n 10, Slope n = 5, Flat n = 4. The box displays the upper and lower quartiles with the median range falling in between (interquartile range). The upper whisker shows 25% of the data which is higher and the lower whisker the 25% which is lower than the interquartile range. Outliers are displayed with a filled (known) or open (suspected) circle.
