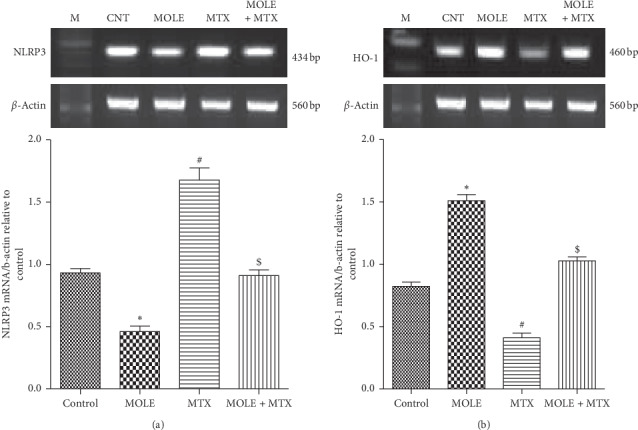
Figure 8.

The ameliorative impact of MOLE on mRNA expression of NLRP3 and HO-1 in MTX-treated mice. Graphic presentation of splenic mRNA levels by semiquantitative PCR analysis of NLRP3 and HO-1 in different groups of mice after normalization with beta actin. ∗P < 0.05 versus control group; #P < 0.05 versus control and MOLE groups; and $P < 0.05 versus MTX-treated group.
