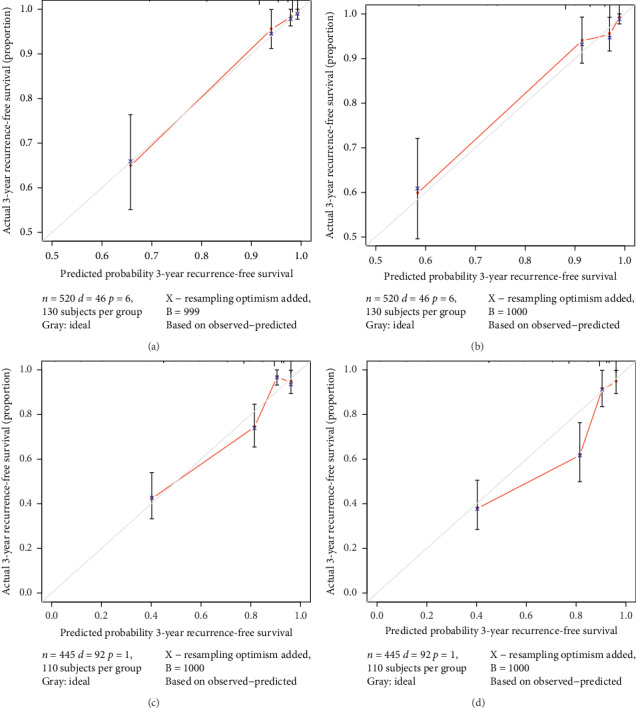
Figure 4.

Calibration of the nomograms for 3- and 5-year recurrence-free survival (RFS) in patients with stage I–IV endometrial cancer in the training and validation cohorts. X-axis indicates the predicting probability of nomogram. Y-axis shows the actual 3- or 5-year probability of survival as assessed by Kaplan–Meier curves. Red line represents the predicted probability of nomogram. Gray line represents ideal consistency between the prediction and actual probabilities of 3- or 5-year RFS. Vertical bars represent 95% CI. Blue dots correspond to the accuracy of the prediction. (a, b) Calibrations of the nomogram in the training cohort for predicting 3- and 5-year RFS. (c, d) Calibrations of the nomogram in the validation cohort for predicting 3- and 5-year RFS.
