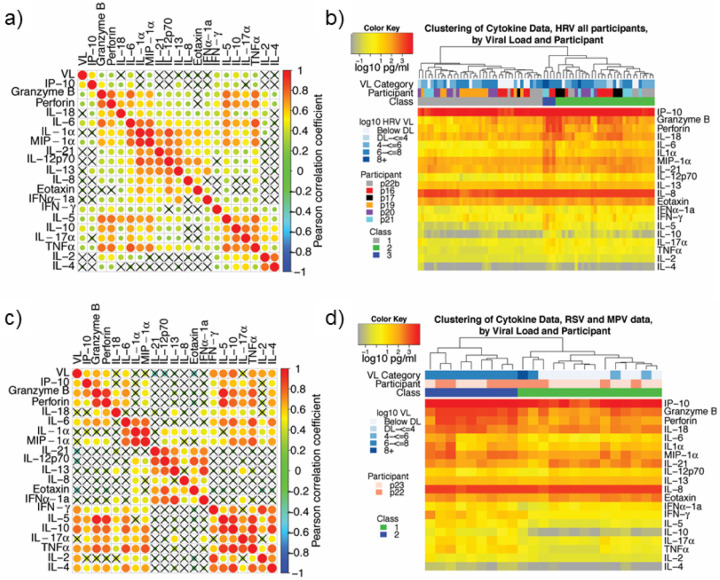
Figure 3: Cytokines correlate according to cellular origin during respiratory virus infection, while samples cluster according to level of inflammation.
(a, b) Data from participants p16, p17, p18, p19, p20, p21 and p22b who have HRV infection. (c, d) Data from participants p22 and p23 who have RSV and MPV respectively. (a, c) Correlation plots with strong correlation according to cell type origin. X indicates a non-significant correlation. Color intensity and the size of the dot are proportional to the Pearson correlation coefficient. For both datasets, strong positive correlations are noted within cytokines linked with cytolytic T-cell responses; macrophage responses; and TH2 responses. (b, d) Linkage clustering analysis of samples (columns) demonstrates classes of samples based on the concentration of inflammatory cytokines. (b) For HRV infections, a minority of samples (blue class) from 2 participants and with the highest levels granzyme B, perforin, IL-6, IL-1α, MIP-1α and IFNγ all had high viral loads. All six participants had samples in the least inflammatory class (grey) and five participants had samples in the moderate inflammatory class (green). (d) For RSV and MPV, inflammatory (blue) and non-inflammatory (green) sample clusters are evident. The inflammatory class of samples is highly associated with the highest viral loads. VL = viral load; DL = detection limit.

