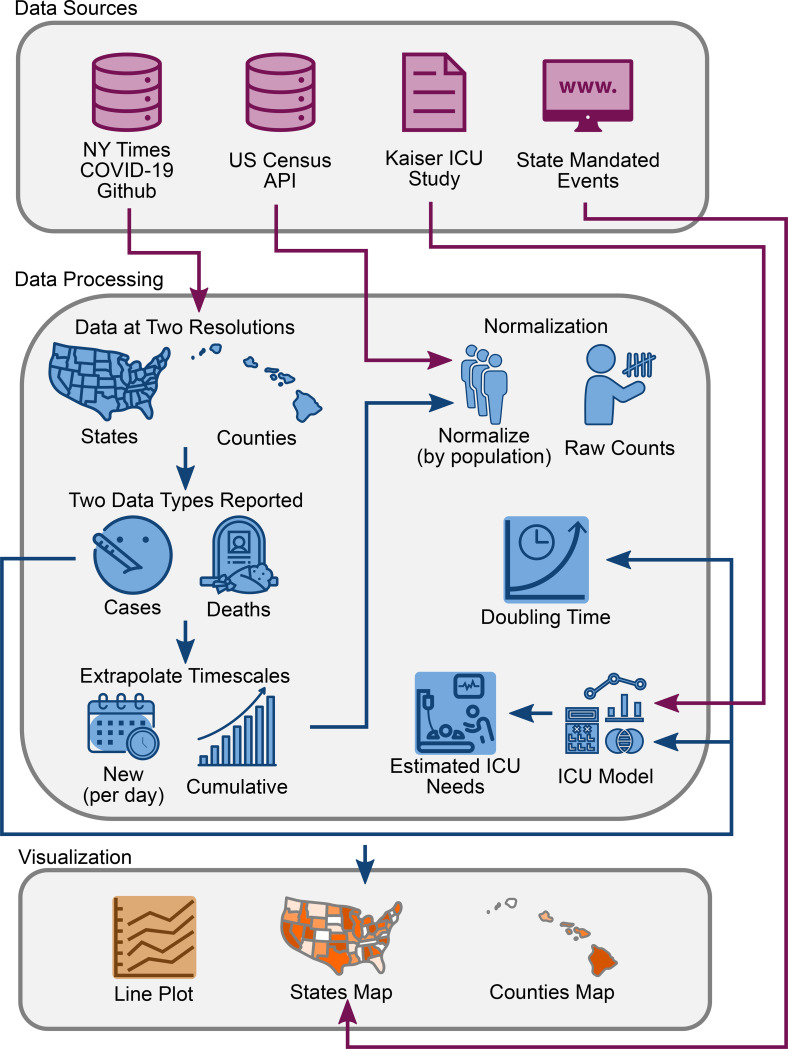
Figure 1: Database schematic.
Source data was obtained from The New York Times, US Census Bureau, Kaiser Health News, and from a manual curation of state governmental websites and news outlets as described in Methods. Data was processed to reflect case and death counts at the level of states and counties. Functions were written to perform x- and y-axis rescaling, normalization by population, doubling time estimation, and ICU bed utilization. Results were depicted using interactive line plots and maps.

