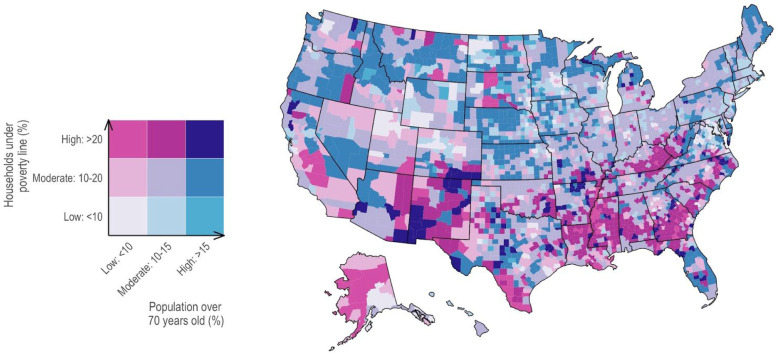
Figure 1.
Percentage of households living in poverty, 2016 (Source: CDC Atlas via the Census Small Area Income and Policy Estimates) and percentage of population 70 years or older, 2018 (Source: National Center for Health Statistics Bridged Race Population Estimates 2018, Vintage 2018). Counties in the Southern US have high levels of poverty (dark reds). Counties in the Midwest have lower rates of poverty but high proportions of older residents (dark blues). 111 counties have both high levels of poverty and an aging population (dark purple). States like Texas exhibit high inter-county variability in risks.

