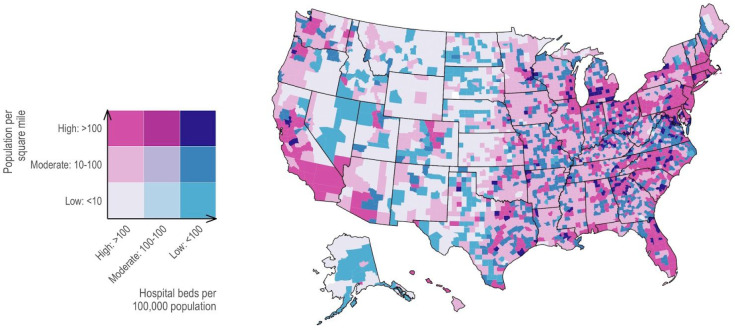
Figure 3B.
Population per square mile of land mass (Source: US Census Bureau) and hospital beds per 100,000 population (Source: Area Health Resources Files). Counties on the East and West coasts have high population density (dark reds), while rural counties have fewer hospital beds per 100,000 population, focused heavily (dark blues). Some counties have high levels of both (dark purple).

