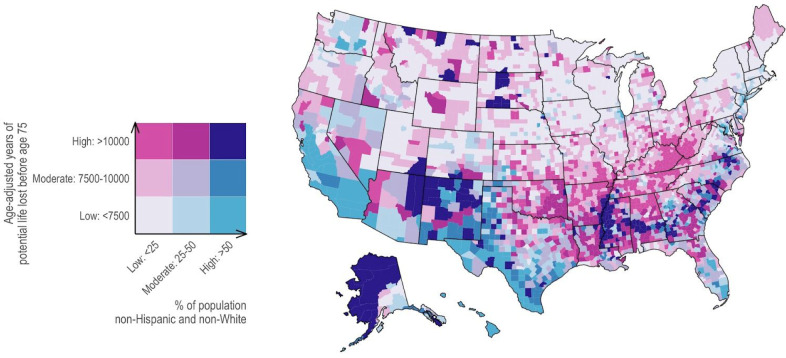
Figure 4.
Age-adjusted years of potential life lost (YPLL) before age 75 per 100,000 population, 2017 (Source: Robert Wood Johnson Foundation County Health Rankings) and percentage of population non-Hispanic and non-White, 2018 (Source: National Center for Health Statistics). Counties with either high rates of YPLL before age 75 per 1000,000 population (dark reds), high proportion of non-Hispanic and non-White (dark blues), or high levels of both (dark purple) are largely concentrated in Southeastern and Southwestern counties.

