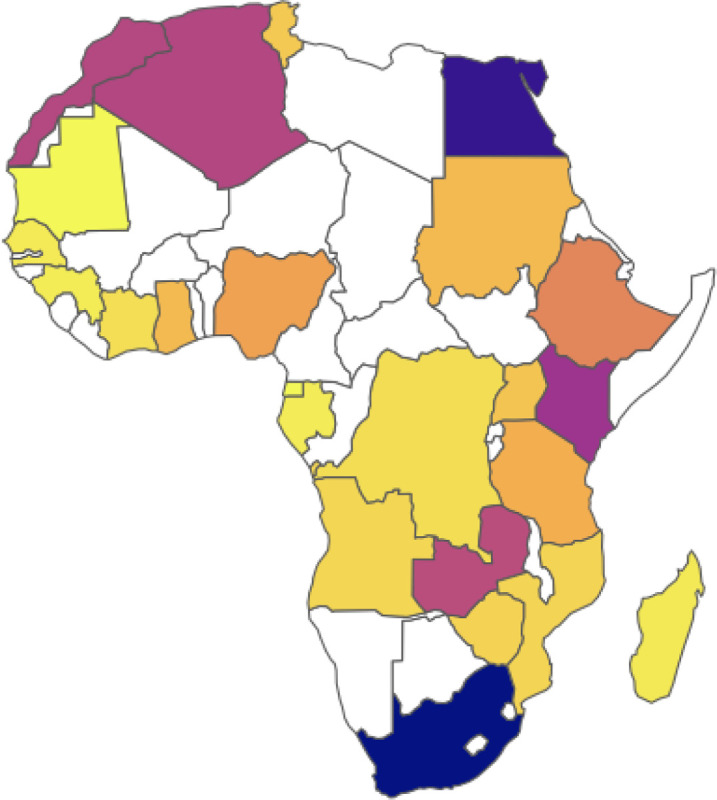
Figure 2.

Map of 24 African locations used in the analysis (two locations not shown are the island nations Seychelles and Mauritius) with countries shaded by the magnitude of predicted imported cases from 18 Chinese cities during our focal time period (1st December 2019 to 29th February 2020) under scenario 1. The predicted cases from all scenarios are given in Table S1. The vast majority of predicted cases (100%; 99.9% - 100%) would have occurred prior to any confirmed cases in those locations. Countries shaded in white are locations for which we do not have data for prediction.
