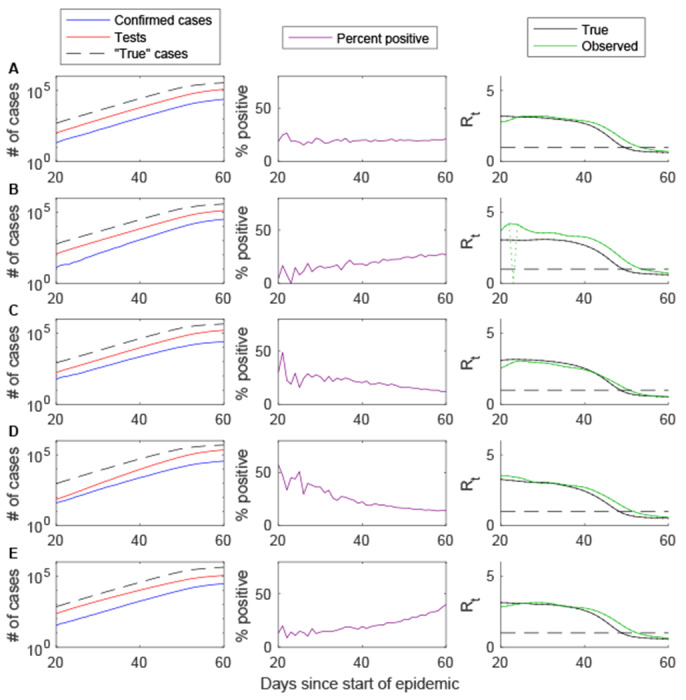
Figure 1. Impact of gradual changes in testing practices on Rt estimation based on simulated data.

The cumulative number of confirmed cases (blue), individuals tested (red), and “true” infections (dashed black line) are plotted on the log10 scale for days 20 to 60 of the simulated epidemic (left), along with the percent of tests positive (purple, middle) and the estimated time-varying reproductive number (Rt, right) for the true cases (black) and confirmed cases (green). (A) Base case in which the fraction of true cases detected and reported and the reporting delay are constant over time and the testing capacity scales with the number of true cases. (B) The fraction of true cases detected increases from 5% to 15% between days 20 and 60. (C) The fraction of cases detected decreases from 15% to 5% between days 20 and 60. (D) The testing capacity increases from 0.2 individuals per case to 0.8 individuals per case between days 20 and 60. (E) The testing capacity decreases from 0.8 individuals per case to 0.2 individuals per case between days 20 and 60.
