
Figure 2. Meta-analysis of lung transcriptomes of patients with COVID-19 morbidities.
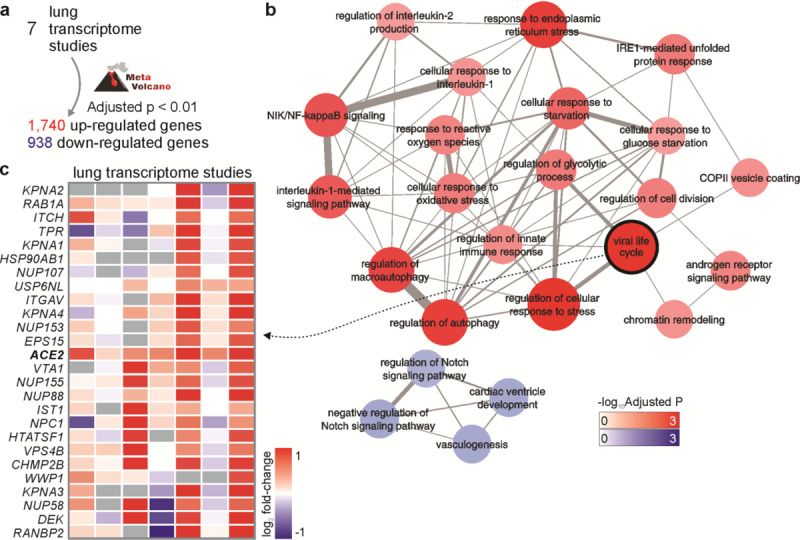
a. Meta-analysis of seven differential expression analyses. Meta-volcano tool was used to combine the p-values of seven studies (Table S1) and to identify the differentially expressed genes (FDR < 0.01). b. Pathway enrichment analysis. Pathways from the “GO Biological Process 2018” database with Adjusted P-value < 0.05 were selected to create the network. The width of edges is proportional to the number of genes shared by two pathways (nodes). The size and color of nodes are proportional to the - log10 Adjusted P-value. c. Genes from the “viral life cycle” pathway that were up-regulated in human diseases. The colors in the heat map represent the log2 fold-change between patients and control individuals.