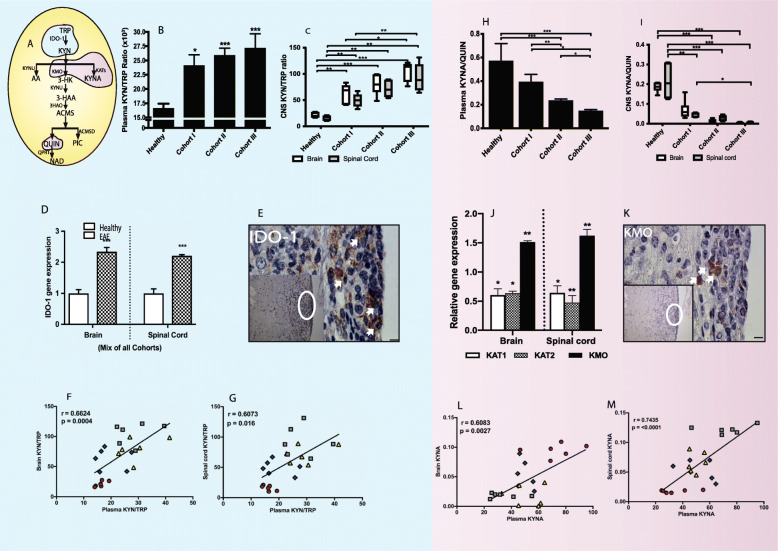
Fig. 2.
Activation of KP and divergence towards neurotoxicity in EAE (experimental autoimmune encephalomyelitis) mice disease progression. a Schematic illustration of kynurenine pathway (KP). b and c The bar diagrams depict kynurenine (KYN) and tryptophan (TRP) ratio (KYN/TRP) (mean ± SD) measured in the plasma (b), brain (white), and spinal cord (gray) (c) in healthy (n = 8) and EAE cohorts (n = 6 per cohort; EAE score of cohort I, 0.5–1; II, 1.5–2; III, 3–4). d The histogram depicts IDO-1 gene expression in the brain and spinal cord of healthy (clear) and EAE-induced (filled) mice. (E) The representative lumbar spinal cord of cohort III EAE mice (n = 2) section stained with IDO-1 protein (white arrow-brown DAB staining). Scale, × 100 and × 20 (inset). f and g The graphs represent relationship of KYN/TRP between plasma and CNS tissues (brain (f) and spinal cord (g)). h and i The bar diagrams depict kynurenic acid (KYNA) and quinolinic acid (QUIN) ratio (KYNA/QUIN) (mean ± SD) measured in the plasma (h), brain (white), and spinal cord (gray) (i) in healthy (n = 8) and EAE cohorts (n = 6 per cohort; EAE score of cohort I, 0.5–1; II, 1.5–2; III, 3–4). j The bar diagrams depict relative KAT1 (white), KAT2 (pattern), and KMO (black) gene expressions in the brain and spinal cord of EAE-induced mice relative to healthy control. k The representative lumbar spinal cord of cohort III EAE mice (n = 2) section stained with KMO protein (white arrow-brown DAB staining). Scale × 100 and × 20 (inset). l and m The graphs represent relationship of KYN/TRP between plasma and CNS tissues (brain (l) and spinal cord (m)). ***p ≤ 0.001; **p ≤ 0.01; *p ≤ 0.05. IDO-1, indoleamine 2,3-dioxygenase; KAT, kynurenine amino transferase; KMO, kynurenine monooxygenase; KYNU, kynureninase; 3HAO, 3-hydroxyanthranilate 3,4-dioxygenase; ACMSD, 2-amino-3-carboxymuconatesemialdehyde decarboxylase; QPRT, quinolinate phosphoribosyl transferase

