
Fig. 1.
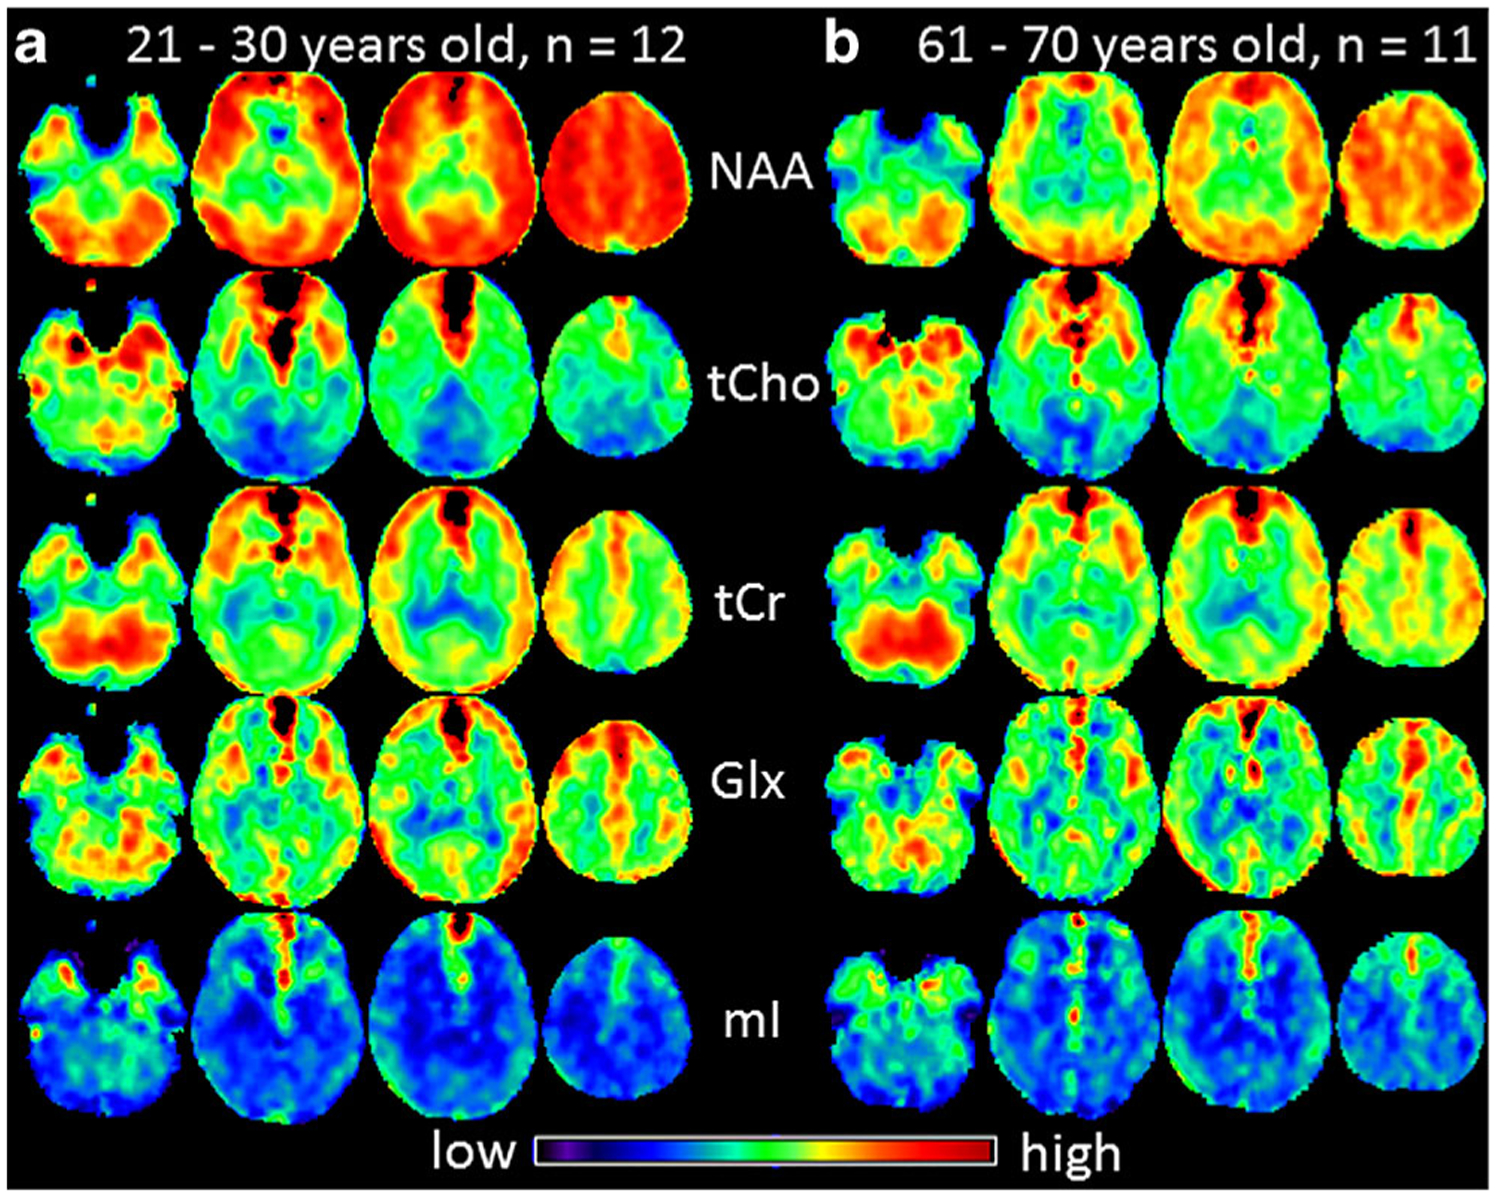
Example mean maps of NAA, tCho, tCr, Glx and mI averaged among subjects of the youngest group (21–30 years old, n = 12, a) and averaged among subjects of the oldest group (61–70 years old, n = 11, b), respectively, are shown. Due to local magnetic field distortions caused by neighboring structures containing bone and air there are some hyperintensive voxels with excessive linewidth, which were excluded in the ROI measurements