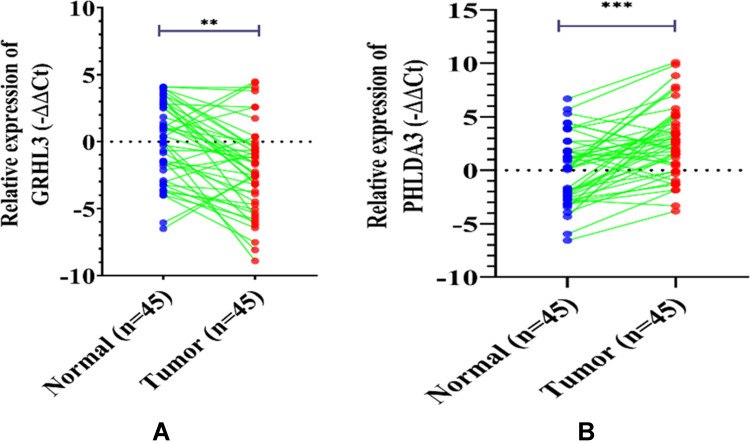
Figure 1.
While GRHL3 expression was downregulated (A), the transcript level of PHLDA3 was increased (B) in HNSC tissues (n=45) compared with ANCTs (n=45). Expression was assessed by qRT-PCR and normalized to SDAH1 expression (shown as the -ΔΔCT method). The data represent the mean±SD of three replicates. **P<0.01; ***P<0.001.

