
Figure 3. Lymph Node Cells from Rewilded Mice Display Increased Cytokine Production in Response to Microbial Stimulation.
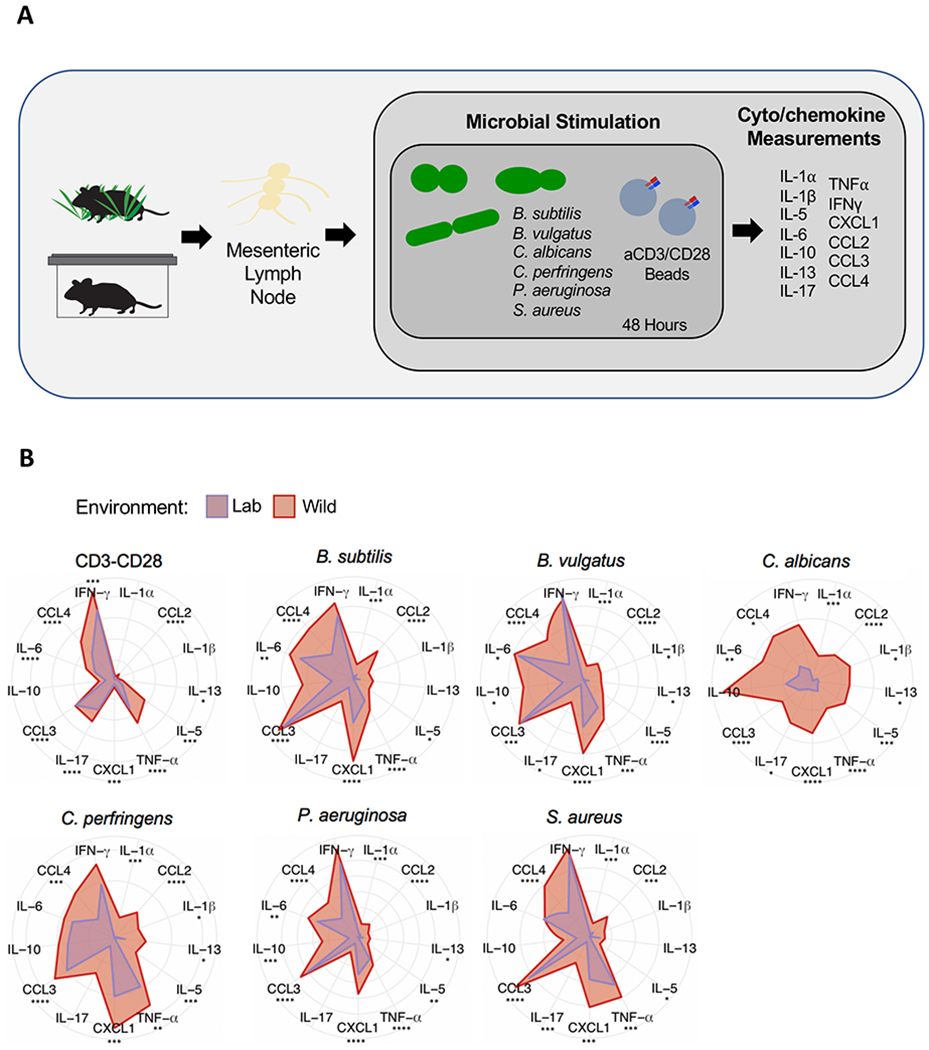
(A) Schematic of the experimental design: single cell suspensions of MLNs from lab and rewilded mice were distributed in 96 well plates containing αCD3/CD28 beads or the following microbes: Bacillus subtilus, Bacteroides vulgatus, Candida albicans, Clostrdium perfringens, and Staphylococcus aureus. The indicated cytokines and chemokines were measured in the supernatant after 48 hours of stimulation. (B) Radar plots showing the amount of each indicated cytokine/chemokine produced in response to the microbial stimulants. Data represents Log2 fold change over MLN cells unstimulated PBS controls. N = 40 lab and 47 rewilded mice. Mean is shown. * P < 0.05, ** P < 0.01, *** P < 0.001, **** P < 0.0001 by two-tailed Student’s t-test between groups, (B).