
Figure 5. Atg16L1 and Nod2 Variants are Associated with Disease Pathology But Do Not Affect Immune Cell Populations.
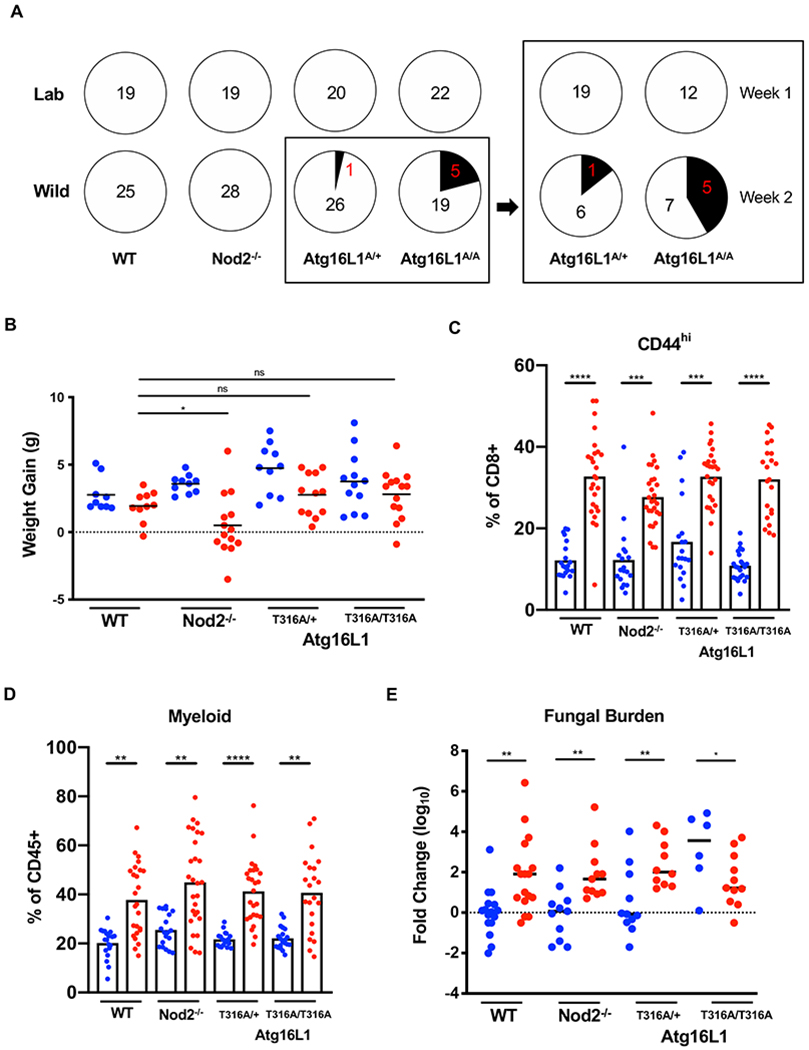
(A) Number of mice presenting diarrhea at time of sacrifice for lab and rewilded wildtype (WT), Atg16l1, and Nod2 mutant mice. Right panel displays number of Atg16l1T300A het (A/+) and homozygous (A/A) mice with diarrhea when sacrificed during the first week or second week of trapping. N > 11 mice per group (B) Weight gain of the WT, Atg16l1, and Nod2 mutant mice over a period of 7 weeks in Lab (blue) and Wild (red) conditions. N > 20 mice per group (C) Quantification of CD44+CD8+ T cells in the peripheral blood of WT, Atg16l1, and Nod2 mutant mice in Lab (blue) and Wild (red) conditions. (D) Quantification of myeloid cells as identified by cell surface markers CD11b/CD11c/DX5. (E) Quantification of relative fungal burden in stool of WT, Atg16l1, and Nod2 mutant mice in Lab (blue) and Wild (red) conditions as determined by ITS qPCR. N > 6 mice per group. Mean and spread are shown. * P < 0.05, ** P < 0.01, *** P < 0.001, **** P < 0.0001 by two-tailed Student’s t-test between groups, (B) to (E). See also Figure S5.