
Figure 6. Altering the Microbiota of Lab Mice Recreates Expansion of Granulocytes Observed in Rewilded Mice.
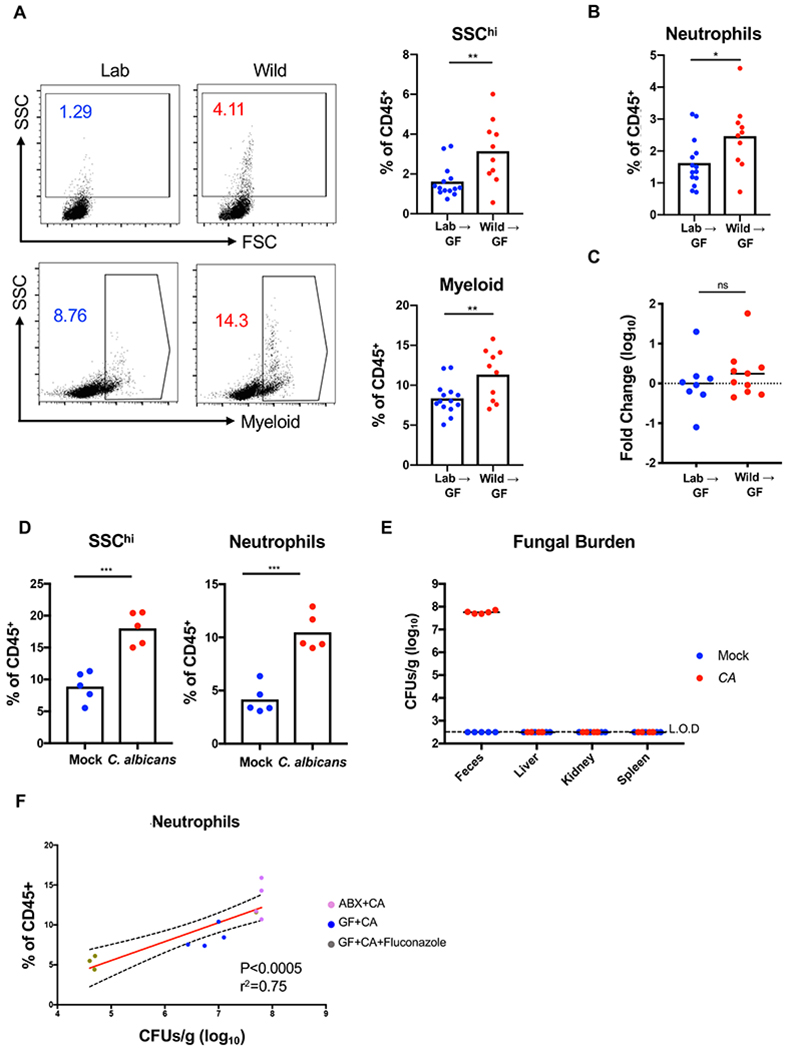
(A) Representative flow cytometry plots and quantification of SSChi cells and myeloid cells (CD11b/CD11c/DX5) gated on Live+CD45+ in the peripheral blood of the F1 progeny from germ-free (GF) mice reconstituted with cecal contents from lab (Lab) and rewilded (Wild) mice. N>10 recipient mice per condition were reconstituted with 3 donor lab and rewilded mice each. Data represents 2 independent repeats. (B) Quantification of the proportion of neutrophils (CD11b+Ly6G+) in the peripheral blood from the mice in (A). (C) Quantification of the relative fungal burden in stool of mice from (A) as determined by ITS qPCR. N = 8 and 10 mice reconstituted with lab and rewilded cecal contents from (A), respectively. (D) Quantification of SSChi cells and neutrophils in the peripheral blood from antibiotic-treated conventional mice 4 weeks post-inoculation with PBS or C. albicans. N = 5 mice per group, 2 independent repeats. (E) Colony forming units (CFUs) of fungi in feces and indicated organs for mice from (D). Dotted line denotes limit of detection (L.O.D.). (F) Linear regression analysis comparing frequency of neutrophils in the blood and fungal CFUs in feces from antibiotics treated mice inoculated with C. albicans(ABX+CA) from (D), germ-free mice mono-associated with C. albicans (GF+CA), and germ-free mice mono-associated with C. albicans and treated with fluconazole (GF+CA+Fluconazole). N = 5 ABX+CA, 4 GF+CA, and 3 GF+CA+Fluconazole. Mean and spread are shown. * P <0.05, ** P <0.01, *** P < 0.001 by two-tailed Student’s t-test between groups, (A) to (D). See also Figure S6.