
Figure 3. Estimates of proportion of heritability mediated by expression from GTEx.
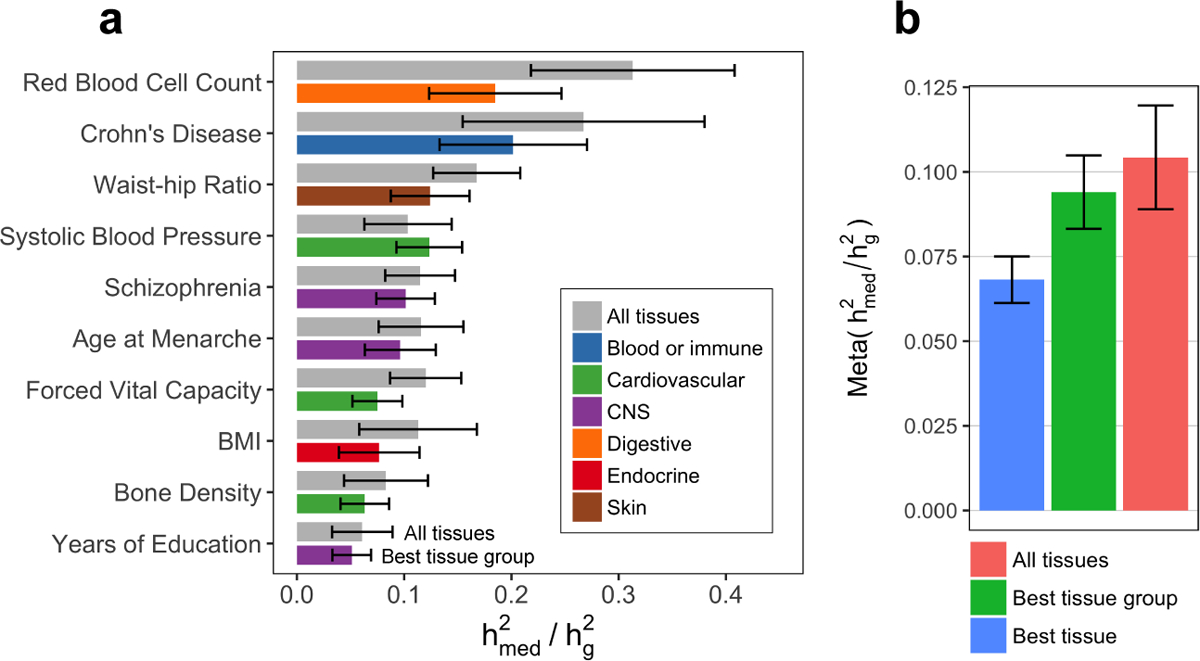
(a) Estimated proportion of heritability mediated by the cis-genetic component of assayed gene expression levels () for 10 genetically uncorrelated traits (average N = 339K). See Supplementary Note for procedure behind selecting these 10 traits and Extended Data 2 for estimates of for all 42 traits. Error bars represent jackknife standard errors. For each trait, we report the estimate for “All tissues” (expression scores meta-analyzed across all 48 GTEx tissues) and “Best tissue group” (expression scores meta-analyzed within 7 tissue groups). Here, “best” refers to the tissue group resulting in the highest estimates of compared to all other tissue groups. (b) estimates meta-analyzed across all 42 traits (average N = 323K). Error bars represent standard errors from random-effects meta-analysis. Here, “Best tissue” refers to the individual tissue resulting in the highest estimates of compared to all other tissues. BMI, body mass index; CNS, central nervous system.