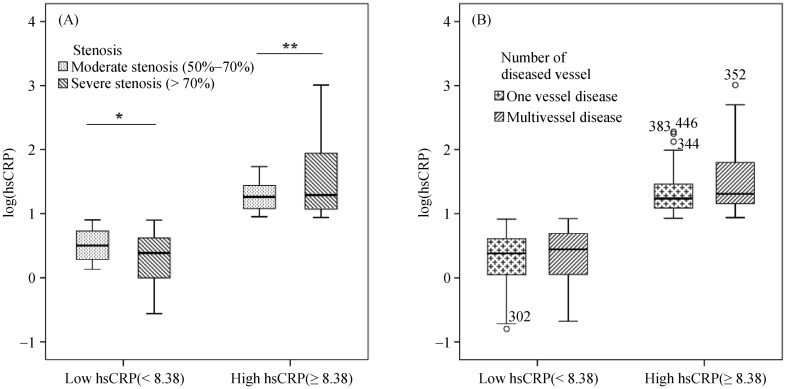
Figure 1. HsCRP and severity of CAD in low and high patient group.
(A): HsCRP levels in high and low groups according to stenosis degree; and (B): HsCRP levels in high and low groups according to the number of vessel disease. *P > 0.05; **P > 0.05. CAD: coronary artery disease; HsCRP: high C reactive protein.

