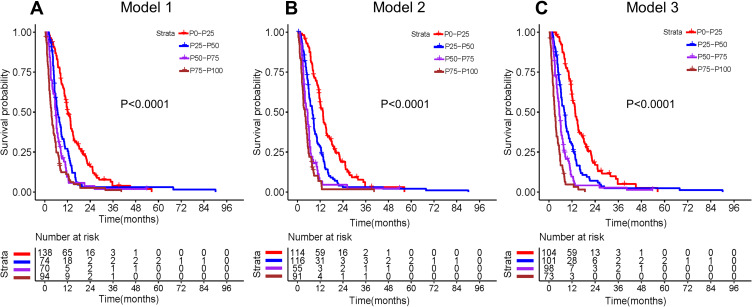
Figure 7.
Kaplan–Meier survival curves of the entire cohort stratified by the quartiles of the calculated total prognostic scores from the three prediction models. (A) CD4+/CD8+ ratio model (model 1); (B) CONUT score model (model 2); (C) combined model of CD4+/CD8+ ratio and CONUT score (model 3).
Abbreviations: CD, cluster of differentiation; CONUT score, controlling nutritional status score.

