Figure 2.
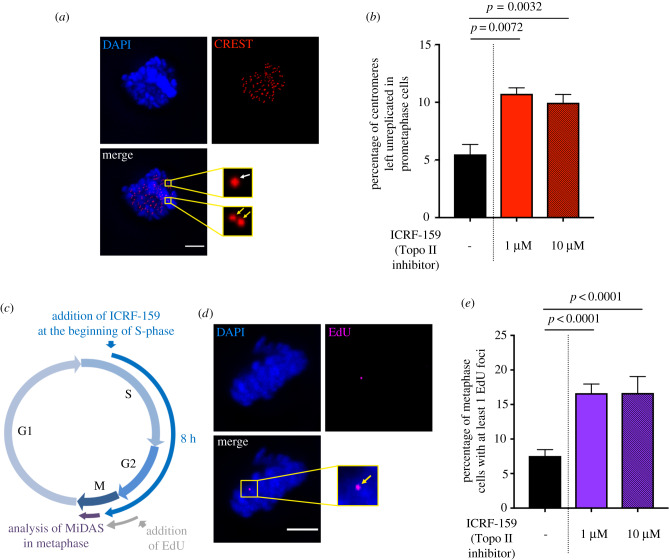
Topoisomerase IIα inhibition impairs complete DNA replication. (a) Representative immunofluorescence deconvoluted z-projection images of a prometaphase HeLa cell. DNA was visualized by DAPI staining (blue). Centromeres were stained with CREST serum (in red). Boxed images are enlarged; single-dotted CREST foci are indicated by white arrows and double-dotted CREST foci are indicated by yellow arrows. Scale bar: 5 µm. (b) Bar graph showing the percentage of centromeres left unreplicated in HeLa prometaphase cells left untreated (black bar) or treated with 1 or 10 µM ICRF-159 for 8 h (red bars). Error bars represent means ± s.d. from three independent experiments (more than 90 prometaphase cells per condition were analysed). (c) Schematic representation of 8 h of Topo IIα inhibition during the cell cycle. Only cells treated during S-phase to mitosis were analysed in anaphase. EdU was added 1 h before analysis. (d) Representative immunofluorescence deconvoluted z-projection images of a metaphase HeLa cell with EdU incorporation. DNA was visualized by DAPI staining (blue). EdU was stained with Alexa Fluor 555 (in magenta). Enlarged image shows one EdU focus on mitotic chromosomes (yellow arrow). Scale bar: 5 µm. (e) Bar graph presenting the percentage of HeLa metaphase cells presenting EdU foci after being left untreated (black bar) or after treatment with 1 or 10 µM ICRF-159 for 8 h (purple bars). Error bars represent means ± s.d. for three independent experiments (100–200 metaphase cells per condition were analysed). Statistical significance was assessed in t-test.

