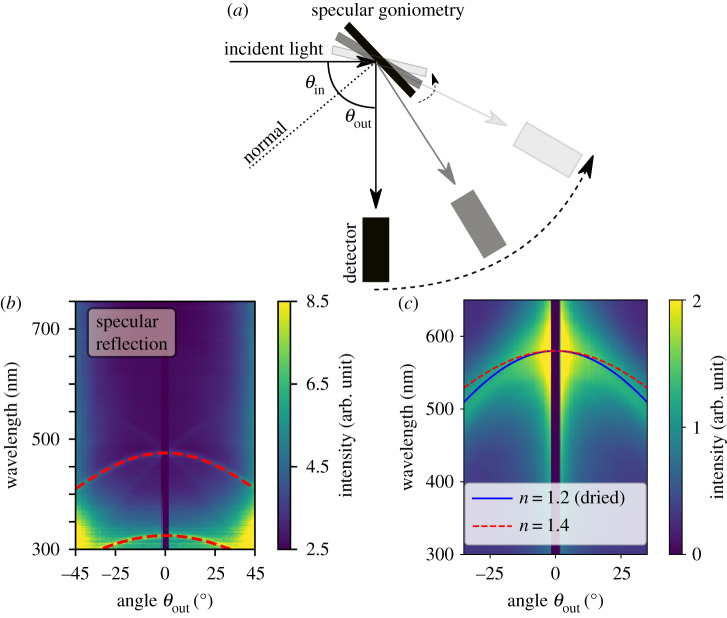
Figure 3.
Specular reflection of bacterial colonies. (a) Sketch of the specular goniometry set-up. (b) Specular measurement for a WT IR1 sample from day 2 with an overlay of the analytical solution equation (2.2), dashed red line. (c) Specular measurement and fit (blue line) of a dried and fixed WT IR1 sample. Refractive index result from (b) shown as red dashed line for comparison.

