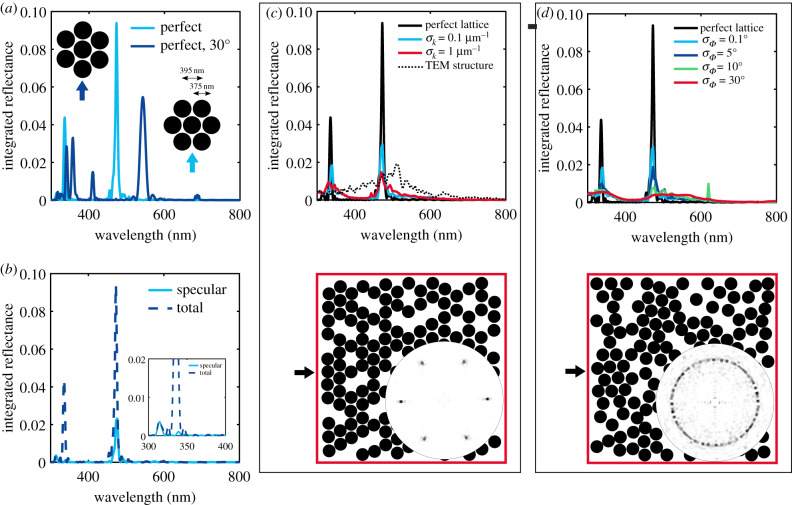
Figure 5.
Introducing disorder in a photonic crystal lattice: FDTD simulations of spheres packed in a hexagonal lattice with diameter 375 nm, lattice distance d = 395 nm, filling fraction f = 0.6 and sample volume 5 × 5 μm (constant number of spheres). (a) Angular integrated reflectance for two different crystal orientations in respect to the incident light (see arrows and sketch in inset). (b) Specular and total integrated reflectance of the ‘perfect’ lattice from (a). (c) Integrated reflectance of the hexagonal lattice with increasing disorder in the particle distance. σk is the error (standard deviation) of the module of the wavevector k. Exemplary structure shown below the figure with corresponding structural correlation in angular space. For comparison, the reflectance spectrum calculated with FDTD from a structure extracted from a TEM image (see electronic supplementary material, figure S4) is shown (dashed-dotted line). (d) Integrated reflectance of the hexagonal lattice with increasing disorder in the particle angular orientation. σΦ is the standard deviation of the angle Φ relative to the incident wavevector. Exemplary structure shown below the figure with corresponding structural correlation in angular space. Incident light direction indicated by black arrows.

