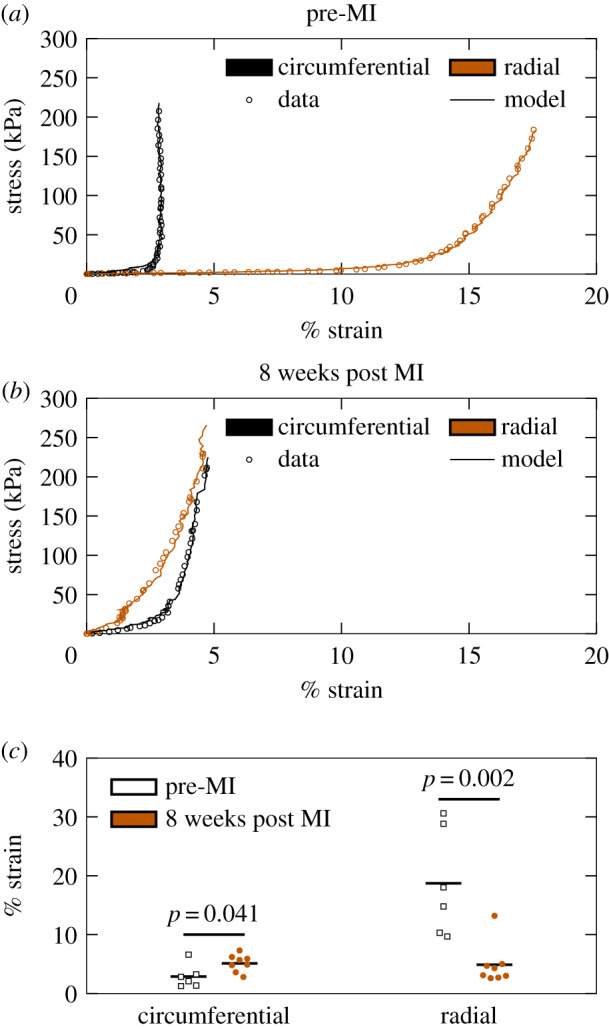
Figure 3.

Biaxial mechanical testing results indicate a loss of mechanical anisotropy at eight weeks post MI. Representative stress/strain curves for (a) pre-MI and (b) eight weeks post MI specimens, with every third datum point plotted to facilitate visualization. (c) Strains at 200 kPa for all specimens tested (pre-MI, n = 6; eight weeks post MI, n = 8). Groups were compared with a Student’s t-test.
