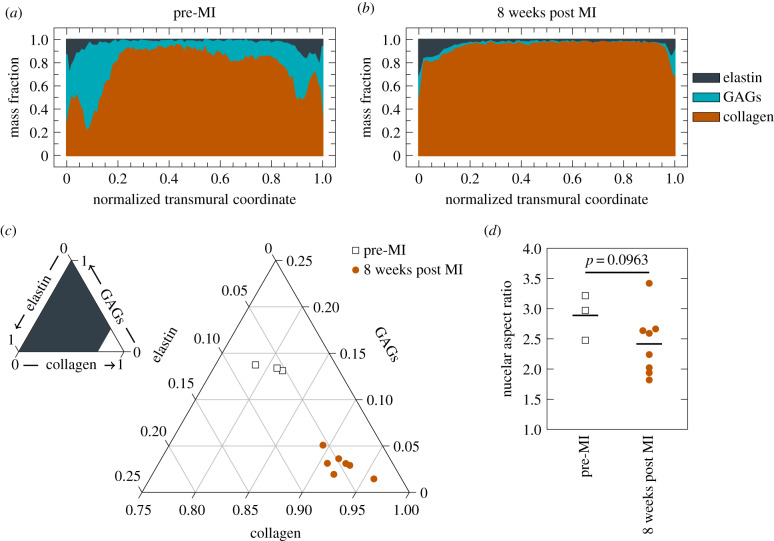
Figure 4.
Leaflet compositional changes. Transmural distribution of ECM constituents (a) pre-MI versus (b) eight weeks post MI. (c) Overall composition change of pre-MI (n = 3) versus eight weeks post MI (n = 8). Groups compared with a Hotelling’s T2 test in the orthonormal coordinate system in described in the Methods. (d) NAR changes pre-MI (n = 3) versus eight weeks post MI (n = 8). Groups compared with a Student’s t-test.

