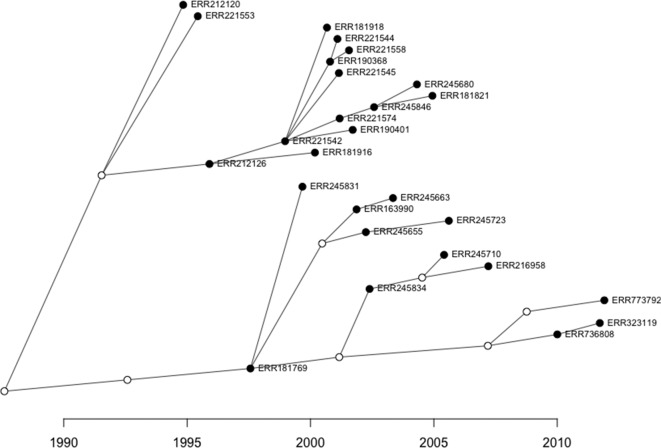
Fig. 3.
An example transmission network of lineage 2 strains reconstructed with TransPhylo software. Sampled cases are illustrated by filled dots and non-sampled, inferred intermediate hosts are indicated with unfilled dots. The direction of transmission is from left to right with the transmission date on the x-axis.

