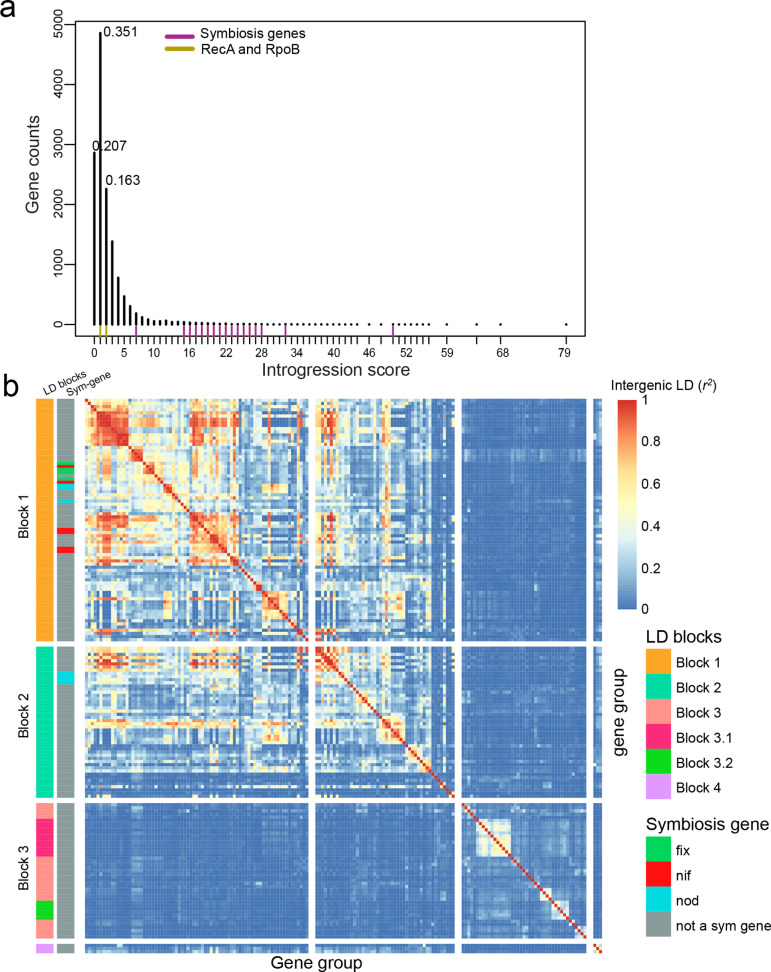
Fig. 3.
Introgression and LD analysis. (a) Distribution of introgression scores based on genes present in at least two genospecies (13 843), the frequencies of the top three introgression scores are shown. (b) Pairwise intergenic LD across highly introgressed genes (171 genes). The x and y axes represent genes ordered by LD clustering (complete method) rather than physical position. Genes were classified by LD blocks and by their contribution to symbiosis (left columns). The warmer the colour the greater the intergenic correlation (r 2). Chromosomal genes are found in LD block 3, while plasmid-borne genes are clustered in the first two blocks.

