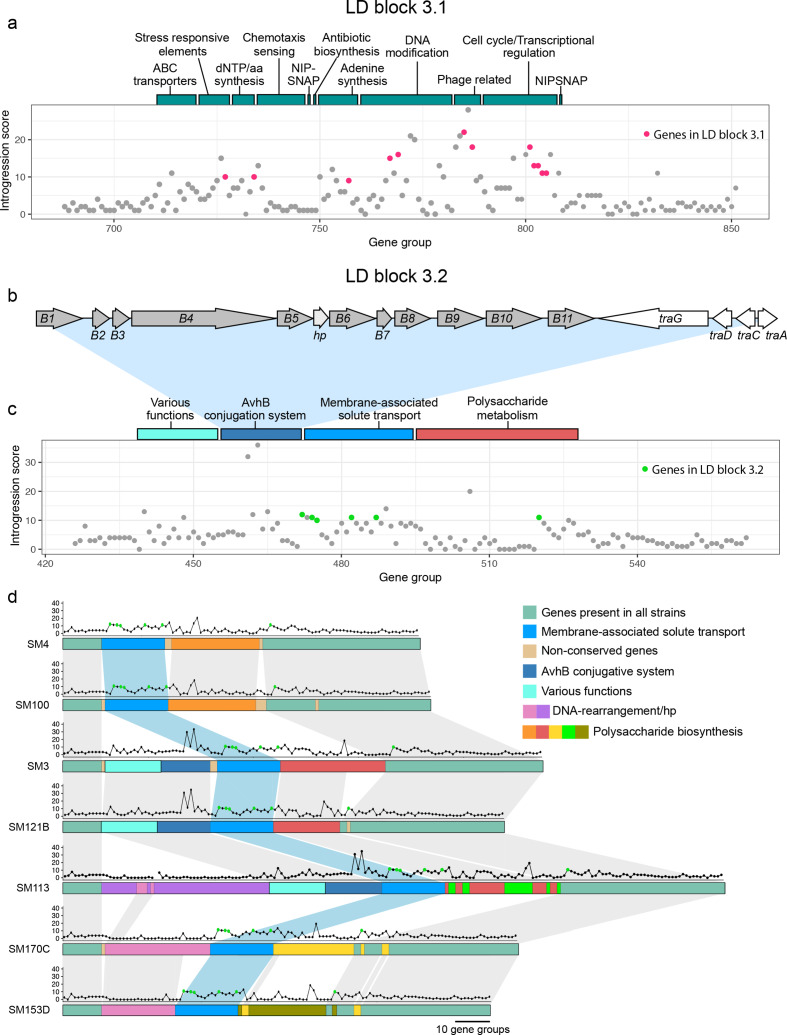
Fig. 4.
Functionality of chromosomal islands. (a) LD block 3.1 in strain SM3. Bars above the chart represent the classification of gene groups found in the region. (b) Gene organization of the avhB/tra type-IV secretion system from SM3. (c) Distribution of introgression scores for LD block 3.2. Coloured bars above the chart represent the classification of gene groups found in the area. (d) Illustration of synteny between gene groups in LD block 3.2 for strains lacking an insert (SM4, SM100), with the avhB/Tra conjugative system (SM3, SM121B), with a DNA rearrangement gene cluster (SM170C, SM153D), and one strain with both inserts (SM113). Dot plots above the gene group lines represent the introgression score for each gene in the gene group. Green dots represent the genes found in LD block 3.2.

