Fig. 3.
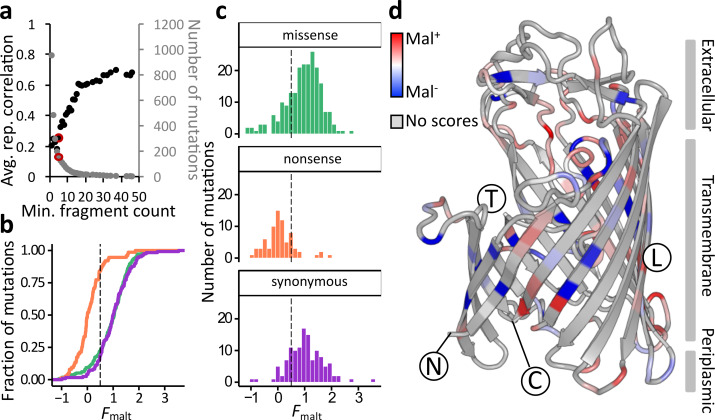
Most missense mutations are unable to strongly disrupt maltodextrin transport. (a) Mutations in lamB were scored in six replicates for their effects on maltodextrin transport by comparing mutation frequencies before and after selection in M9+maltodextrin, and the scores were compared between replicates. The relationship between the replicate correlation and fragment input count threshold is as for Fig. 2. The fragment input count threshold of five is highlighted in red. ‘rep’: replicate. (b) The empirical cumulative distribution function of F malt scores, which estimate mutational effects on maltodextrin transport from zero (nonsense-like) to one (synonymous-like). The missense distribution is not significantly different from the synonymous distribution (P=0.65, Kolmogorov–Smirnov test). Green: missense mutations. Orange: nonsense mutations. Purple: synonymous mutations. The dotted line represents the threshold, F malt=0.5, above which mutations are called Mal+. (c) The distribution of fitness effects for the maltodextrin selection, for all scored single nucleotide mutations, averaged over six replicates. Colours and dotted line are as in (b). (d) The mean F λ score of mutations at each residue in LamB, coloured relative to other residues from Mal+ (red) to Mal- (blue). Structural features described in the text are annotated, but see also Fig. S4. N: the amino-terminus of the mature protein. C: the carboxyl-terminus of the mature protein. T: the face of the protein that binds other monomers to form the functional trimer. L: the face of the protein exposed to the lipid bilayer.

