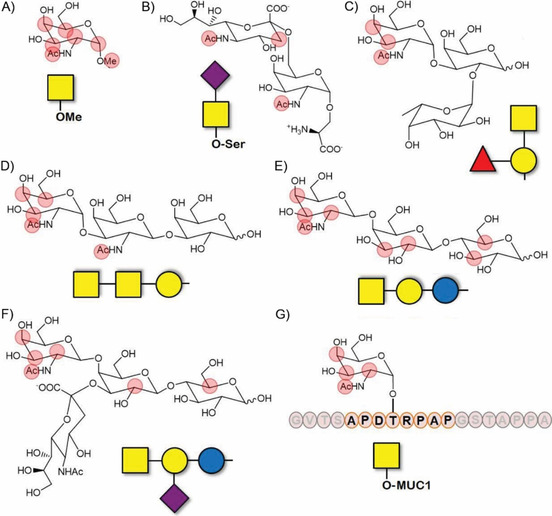
Figure 12.

Schematic representation of the STD profiles described for different MGL ligands.[217,227,232] To clarify, for each antigen only those STDs above 50 % in relative scale are depicted as red circles. In all cases, recombinant soluble MGL‐ECD has been used for data recording (in B, it was additionally tagged with myc and associated to anti‐myc AB and streptavidin). A) α‐OMe‐GalNAc. B) sialyl‐Tn antigen. C) Blood group A trisaccharide. D) Forsmann antigen. E) asialo‐GM2. F) GM2. G) GalNAc linked to a MUC1 repeat. In this case, the peptide residues displaying weaker STD effects are also highlighted in orange.
