
Figure 1.
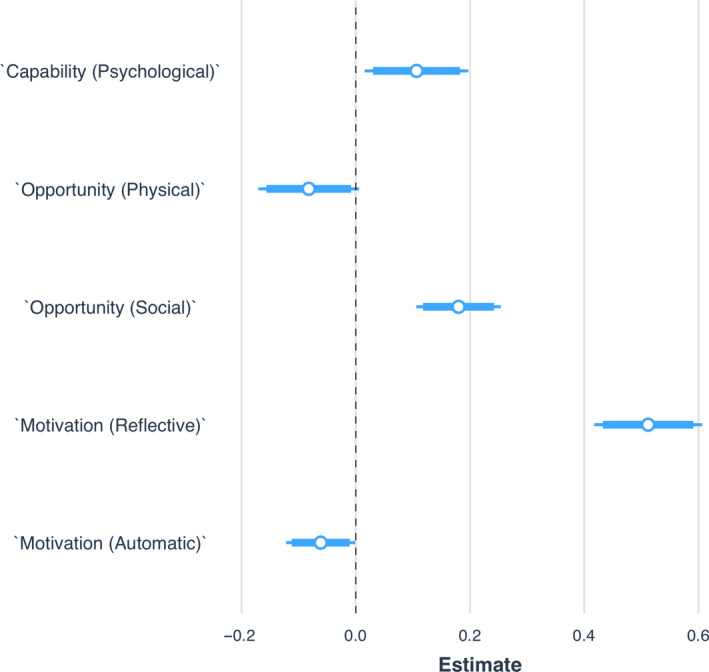
Effects of COM‐B Subscales on Hygienic Practices. Notes: Plot points are unstandardized regression coefficients from an OLS model; 95% and 90% confidence intervals indicated by the narrow and thick error bars, respectively.
Notes. Plot points to the right of the vertical line indicate an increase in hygienic practices; those to the left a decrease. To aid in interpretation, all predictors have been rescaled from 0 to 1