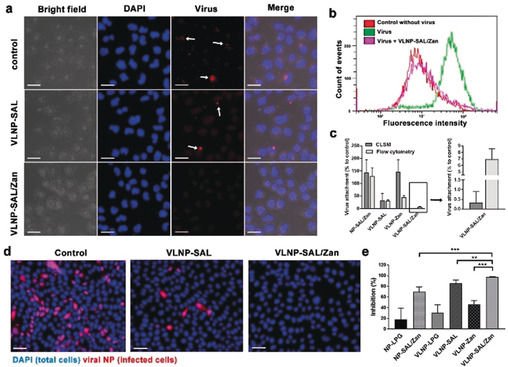
Figure 3.

a) Projection CLSM images for virion binding to MDCK II cells in the presence of the inhibitors. Scale bar: 20 μm. b) Flow‐cytometry analysis for the virion binding to MDCK II cells in the presence of VLNP‐SAL/Zan. c) Virus attachment analysis for the CLSM images and flow‐cytometry results. Values are expressed as mean±SD, n=4. d) Immunofluorescence staining of the viral NP to show the cellular infections at an MOI of 1. Scale bar: 50 μm, MOI=multiplicity of infection. e) Inhibition ratios for the nano‐inhibitors from the counting of infected cells. Values are expressed as mean±SD, n=4. **p<0.01, ***p<0.001 by Student t‐test. Detailed data for other inhibitors are shown Figure S7 and S8.
