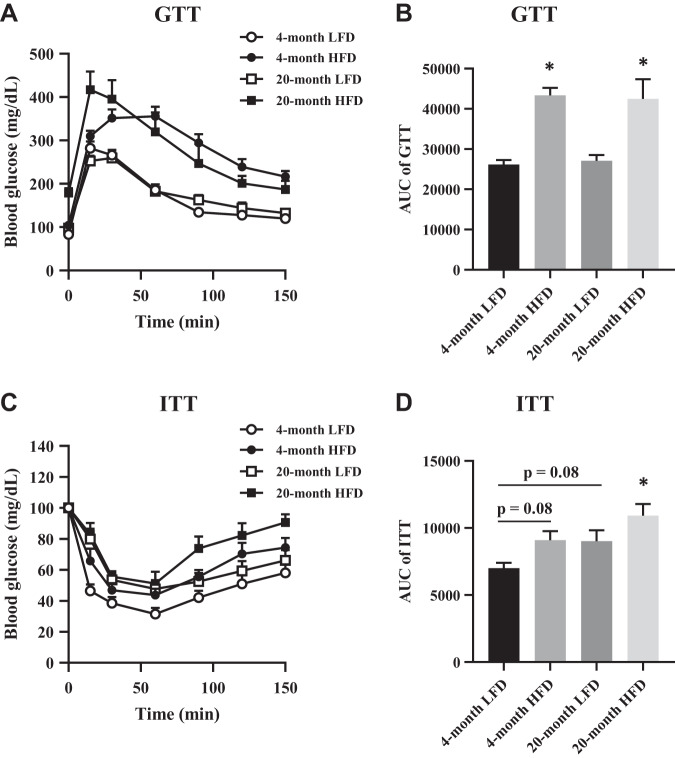
Fig. 1.
Parameters of insulin sensitivity. A: glucose tolerance test (GTT). B: area under the curve (AUC) quantification of GTT results; n = 5–10 per group. C: insulin tolerance test (ITT). D: AUC quantification of ITT results; n = 5–9 per group. HFD, high-fat diet. The data are presented as the means ± SE. *P < 0.05 vs. 4-mo low-fat diet (LFD).

