Fig. 2.
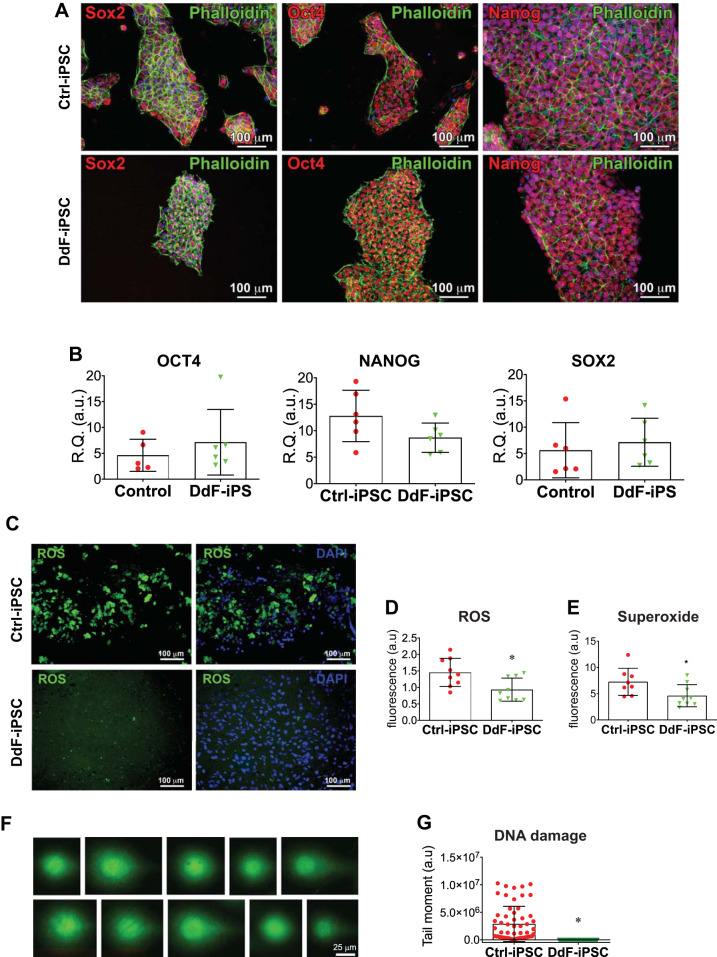
Characterization of DNA-damage-free induced pluripotent stem cells (DdF-iPSCs). A: confocal micrographs of control (Ctrl) iPSCs and DdF-iPSCs showing expression of pluripotent markers Sox2, Oct4, and Nanog. B: DdF-iPSCs and Ctrl-iPSCs analyzed by quantitative RT-PCR for transcript expression of pluripotent markers Sox2, Oct4, and Nanog. (n = 6). t-test was performed. Data are means ± SD. C–E: reactive oxygen species (ROS; green) evaluated using fluorescence staining in Ctrl-iPSCs and DdF-iPSCs. Quantification of relative expression of ROS (D; n = 9) and superoxide (E; Ctrl, n = 8; DdF, n = 9) to number of cells is shown. t-test was performed. Data are means ± SD. *P < 0.05. F: DNA damage in nucleoids of Ctrl-iPSCs analyzed by comet assay. G: quantity of damaged DNA in nuclei of iPSCs in Ctrl-iPSCs (n = 58 comets) and DdF-iPSCs (n = 71 comets). t-test was performed. Data are means ± SD. *P < 0.05. R.Q., relative quantity; a.u., arbitrary units.

