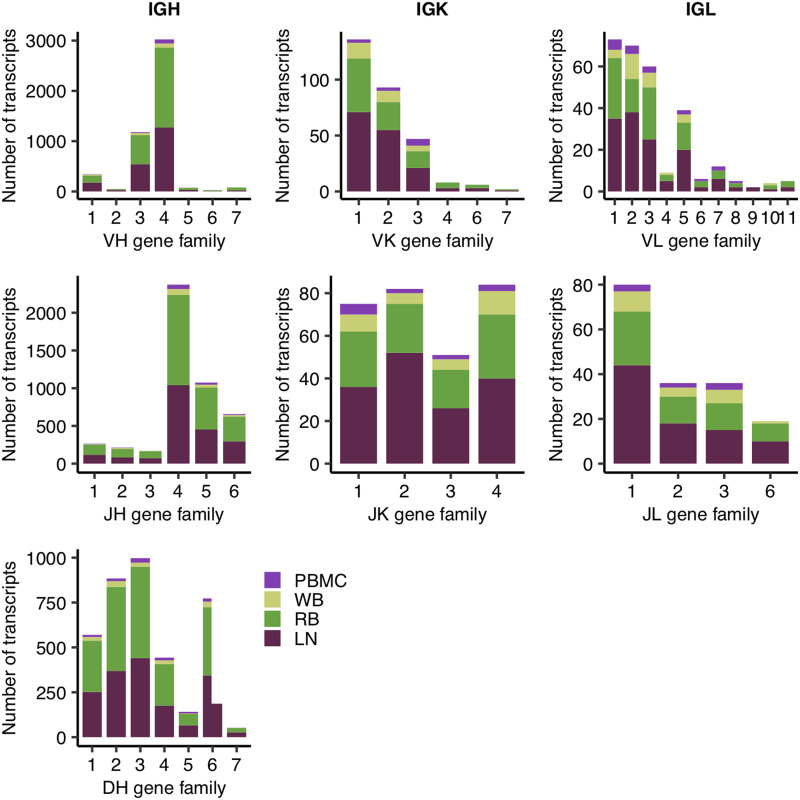
FIGURE 1.
Stacked bar plot of absolute transcript abundance of V, D, and J genes for each Ig chain type, where colors of the bar indicate the tissue source of the gene. Variable gene abundance was computed using full-length Ig transcripts reported in Table I. Each individual plot shows the various known gene families of a particular gene segment type (e.g., VH), in which gene families are clusters of highly similar gene segments within that gene segment type.

