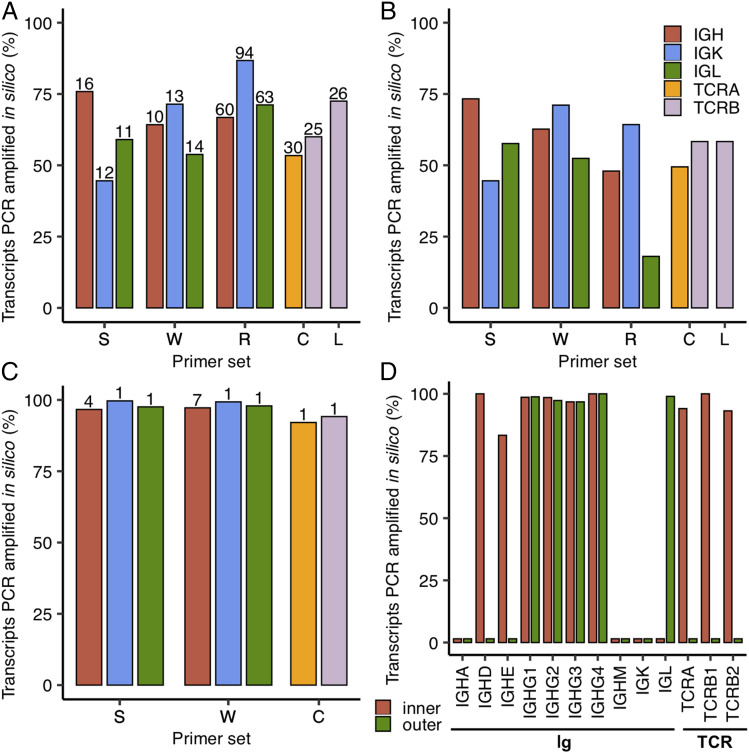
FIGURE 4.
In silico PCR analysis of rhesus-specific primers from Sundling et al. (S) (28), Wiehe et al. (W) (29), Rosenfeld et al. (R) (32), Chen et al. (C) (66), and Li et al. (L) (67) as well as human 10× B and T cell V(D)J reverse primers (68). Only the inner primers were tested for S and W, whereas both inner and outer 10× primers were tested. The primers from C target both TCRA and TCRB, whereas those from L only target TCRB as indicated by the bars shown in (A–C). The percentage of transcripts amplified in silico are shown as bars for different primer sets and types of transcripts. (A) Amplification in which only primers targeting the V gene segment within the V region from S, W, R, C, and L are tested with the total number of primers (after enumerating primers with degenerate nucleotides) shown above the bars. (B) Amplification using forward (V gene) and reverse (J gene segment or C region) primers from S, W, R, C, and L. (C) Amplification in which only primers targeting the C region from S, W, and C are tested with the total number of primers (after enumerating primers with degenerate nucleotides) shown above the bars. R and L are not shown here as their reverse primers target J gene segments. (D) Analysis of 10× B and T cell V(D)J inner and outer reverse primers. The different groups of transcripts (Ig and TCR) are noted below the bar plot.

