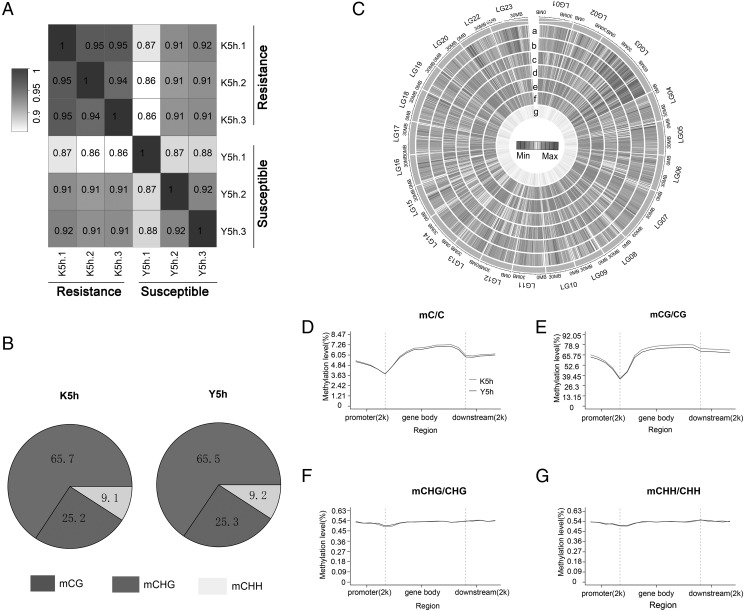
FIGURE 2.
Methylation profiles of spleen samples in resistant and susceptible tilapia. (A) Pearson correlation coefficient of genome-wide CpG methylation between the resistant and susceptible groups. (B) The proportion of mCs (mCG, mCHG, mCHH) in resistant and susceptible tilapia at 5 h after S. agalactiae infection. (C) Heatmap representation of average methylation densities in 300-kb windows independent of sequence context. a, mCG_K5h; b, mCG_Y5h; c, mCHH_aK5h; d, mCHH_Y5h; e, mCHG_K5h; f, mCHG_Y5h; g, gene density. The mC (D), mCG (E), CHG (F), and CHH (G) methylation levels in different sequence regions of resistant and susceptible groups.

