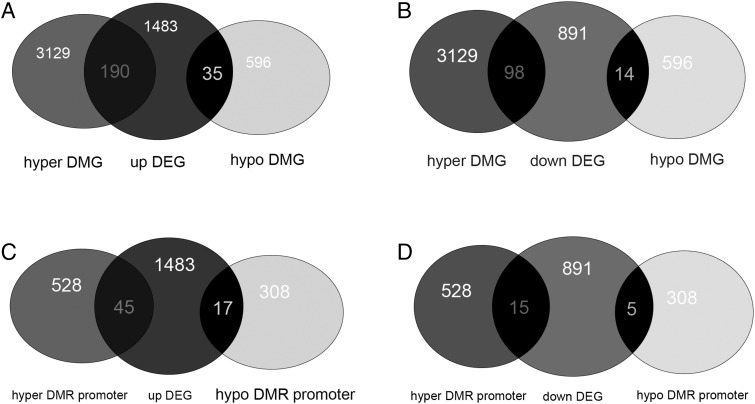
FIGURE 4.
Selection of condition-specific genes. (A) Venn diagram showing the number of overlapping genes of upregulated DEG and DMG. (B) Venn diagram showing the number of overlapping genes of downregulated DEG and DMG. (C) Venn diagram showing the number of overlapping genes of upregulated DEG and DMR promoter. (D) Venn diagram showing the number of overlapping genes of downregulated DEG and DMR promoter.

