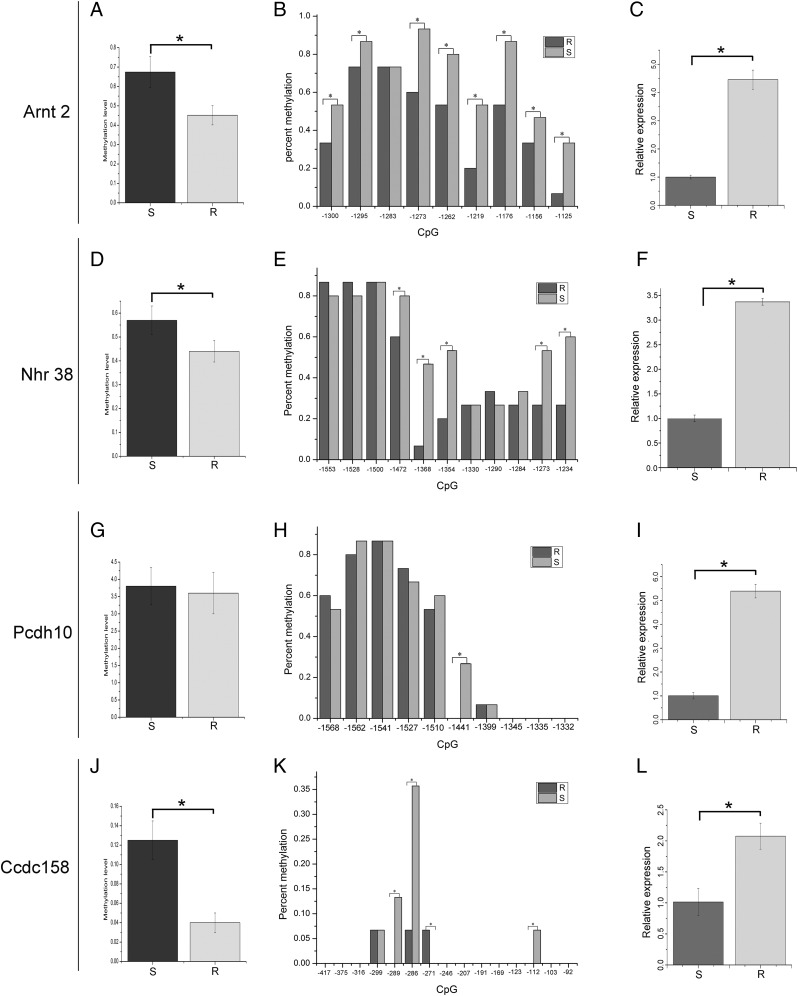
FIGURE 5.
Promoter methylation level and gene expression. (A) Difference in Arnt2 promoter methylation level of resistant (R) and susceptible (S) groups; (B) each CpG site methylation level difference in Arnt2 gene promoter regions of R and S groups; (C) difference in Arnt2 gene expression of R and S groups; (D) difference in Nhr38 promoter methylation level of resistant and susceptible groups; (E) CpG site methylation level difference in Nhr38 gene promoter regions of R and S groups; (F) difference in Nhr38 gene expression of R and S groups; (G) difference in Pcdh10 promoter methylation level of R and S groups; (H) each CpG site methylation level difference in Pcdh10 gene promoter region of R and S groups; (I) difference in Pcdh10 gene expression of R and S groups; (J) difference of Ccdc158 promoter methylation level between R and S groups; (K) CpG site methylation level difference in Ccdc158 gene promoter regions of R and S groups; (L) difference in Ccdc158 gene expression of R and S groups. *p < 0.05.

