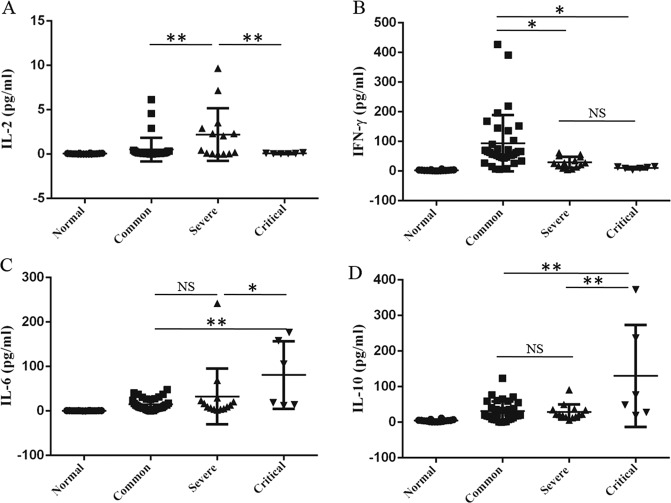
Fig. 3. The cytokine profile in plasma of patients with COVID-19 pneumonia.
The patients were enrolled and divided into common, severe, and critical types. The levels of II-2 (a), IFN-γ (b), IL-6 (c), and IL-10 (d) in plasma of patients and normal controls were analyzed by luminex. The experiment shown was replicated in the laboratory twice. ANOVA followed by post hoc LSD was used to compare differences between groups. *P < 0.05 and **P < 0.01.

