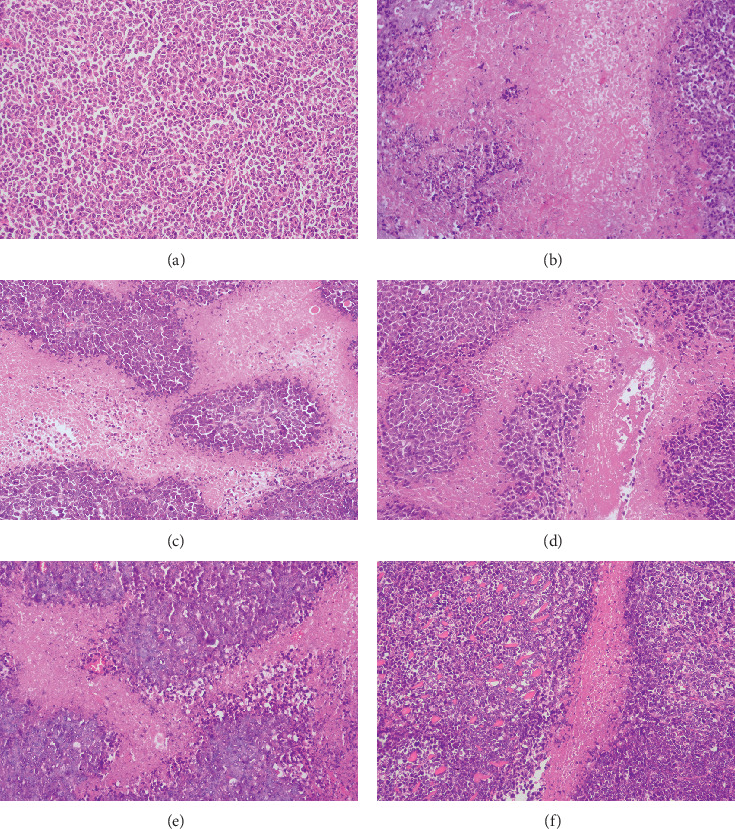
Figure 6.

Microscope pictures of tumor slices of different groups by H&E staining (magnifying 200 times). (a) Model group; (b) adriamycin group; (c) high-dose GAMCLCL group; (d) middle-dose GAMCLCL group; (e) low-dose GAMCLCL group; (f) curcumin group.
