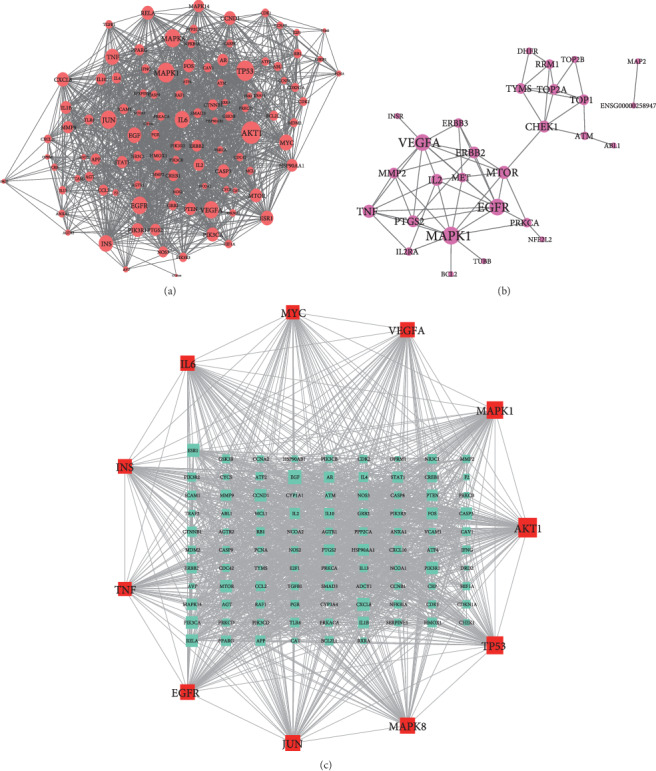
Figure 2.

PPI network analysis. (a) Protein-protein interaction network of common genes of HCT-related genes of lung cancer. Note: round red nodes stand for hub targets of PPI network of common gene targets between ingredients contained in HCT and related genes of lung cancer. The greater the degree of the node was, the greater the size of the node was. (b) Protein-protein interaction network of common genes of HCT-known therapeutic gene targets of lung cancer. Note: round purple nodes stand for hub targets of PPI network of common gene targets between ingredients contained in HCT and known therapeutic gene targets of lung cancer. The greater the degree of the node was, the greater the size of the node was. (c) PPI interaction network of hub genes between HCT-related genes of lung cancer PPI network and HCT-known therapeutic gene targets and of lung cancer PPI network. Note: square red nodes stand for major hub targets of PPI network. Square cyan nodes stand for the other hub genes. The greater the degree of the node was, the greater the size of the node was.
