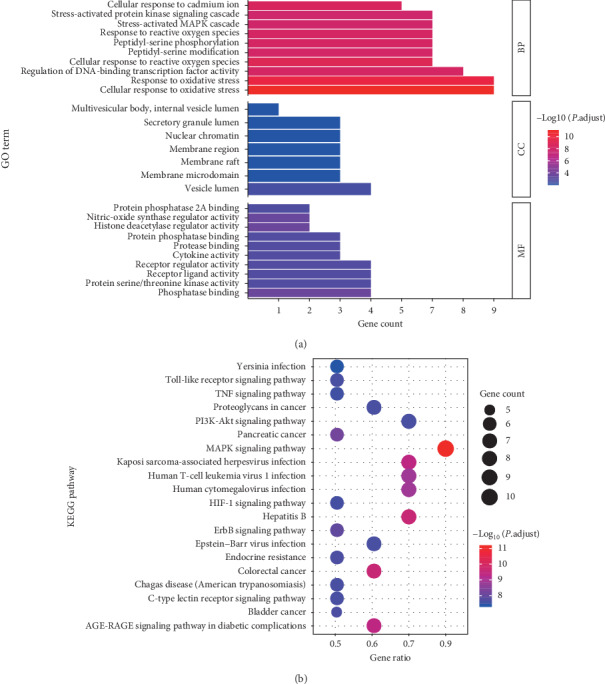
Figure 3.

Gene Ontology (GO) and KEGG pathway enrichment analysis. (a) Main Gene Ontology terms enriched by major hubs from clusterProfiler. The top 10 terms of BP, MM, and CC measured by adjusted P value were selected to demonstrate. Note: the color of terms turned from blue to red. The redder the bar was, the smaller the adjusted P value was. (b) KEGG pathway enriched by major hubs from clusterProfiler. The top 20 terms of pathways measured by adjusted P value were selected to demonstrate. Note: the color of terms turned from blue to red. The redder the bubble was, the smaller the adjusted P value was. BP: biological processes; MF, molecular function; CC: cellular component.
