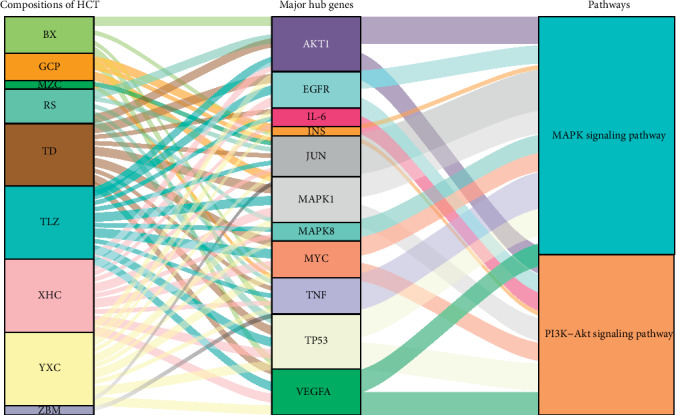
Figure 4.

Sankey diagram of interaction between herbs of HCT, major hub genes, and two main pathways. Note: the herbs, major hub genes, and main pathways were displayed in different colors. The height of the rectangle and the width of the connecting line were positively correlated with the number of other rectangles they connected.
