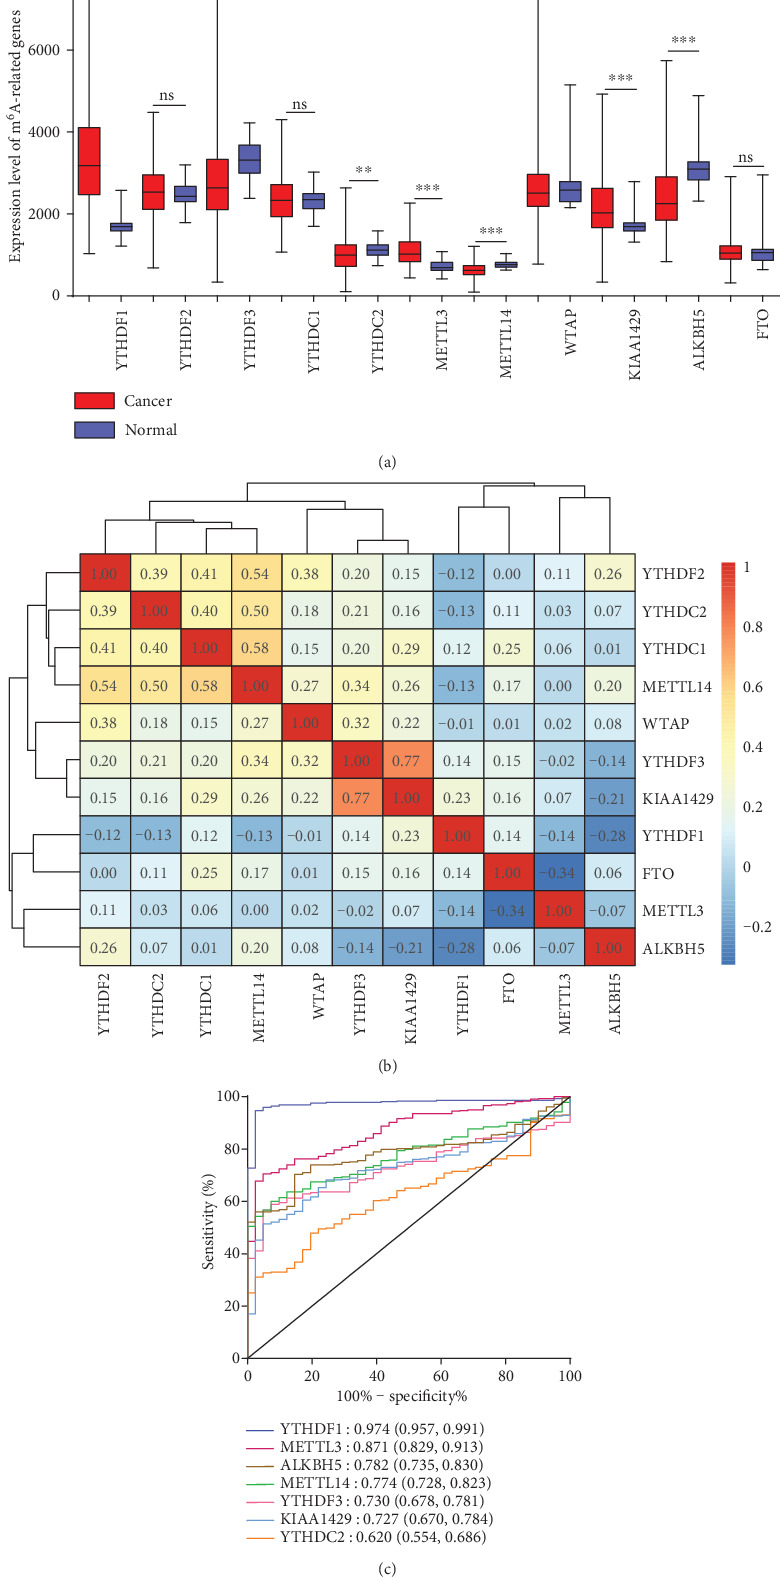
Figure 1.

The landscape of m6A RNA methylation regulators in COAD. (a) The expression level of m6A RNA methylation regulators in cancer and normal tissues. ns: P ≥ 0.05; ∗: P < 0.05; ∗∗: P < 0.01; ∗∗∗: P < 0.001. (b) The Pearson correlation matrix among 11 m6A modification regulators in COAD. The correlation coefficient is shown in each grid with different colors. The redder the color is, the higher the correlation coefficient; the bluer the color is, the lower the correlation coefficient. (c) ROC curves of seven differentially expressed m6A RNA methylation regulators. Each curve represents a candidate gene, and the AUC is shown at the bottom right.
