Figure 2.

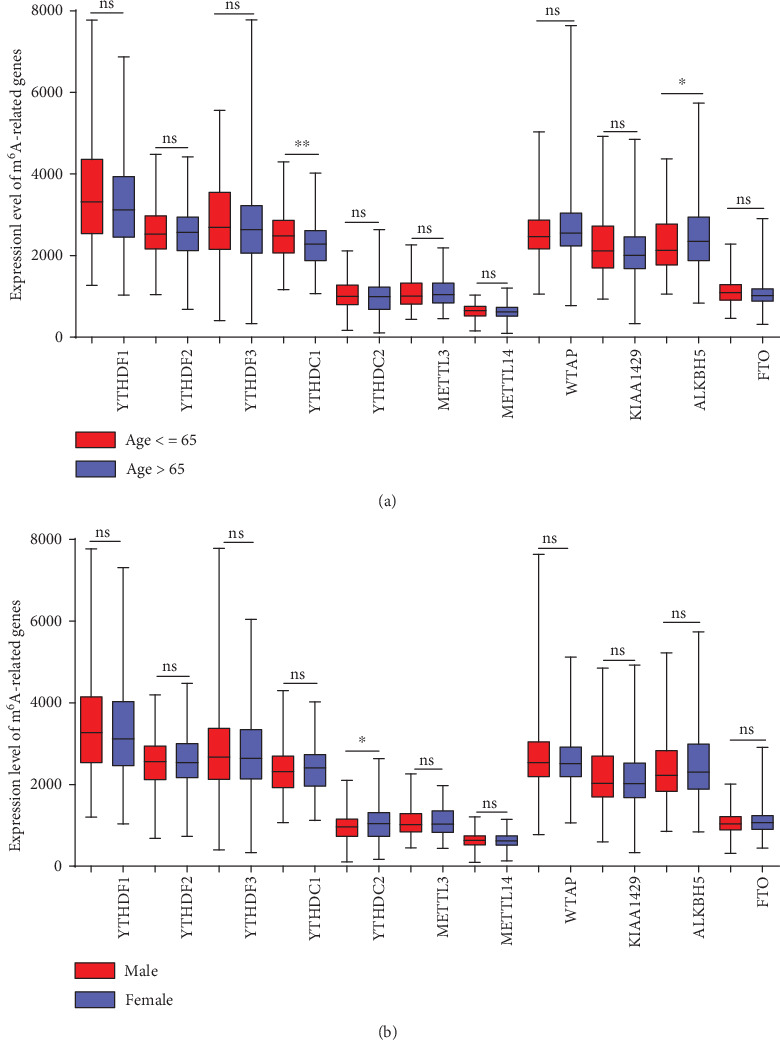
The relationship between m6A RNA methylation regulator expression and clinical features of COAD. (a) Expression levels stratified by age group. (b) Expression levels stratified by sex. ∗: P < 0.05; ∗∗: P < 0.01; ns: P ≥ 0.05.

The relationship between m6A RNA methylation regulator expression and clinical features of COAD. (a) Expression levels stratified by age group. (b) Expression levels stratified by sex. ∗: P < 0.05; ∗∗: P < 0.01; ns: P ≥ 0.05.