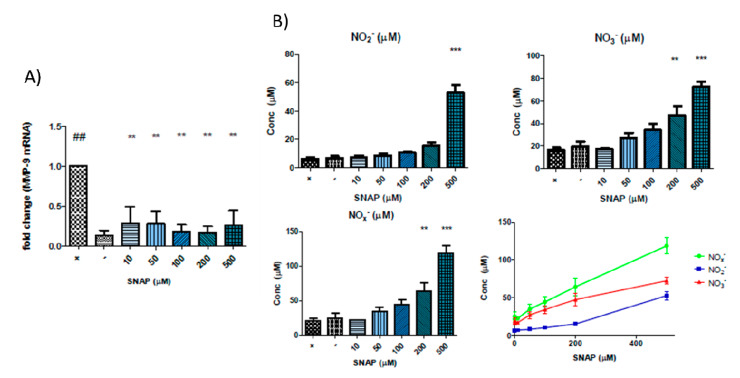
Figure 4.
(A) SNAP significantly reduced MMP-9 mRNA at different concentrations tested in cytokine-stimulated Caco-2 cells: ## p < 0.01 vs. unstimulated Caco-2 cells (negative control); ** p < 0.01 vs. cytokine-stimulated Caco-2 cells (positive control). (B) Measurements of nitrate and nitrite concentrations as breakdown products of NO by the Griess assay on the conditioned media of Caco-2 cells after 24 h of co-incubation with SNAP and proinflammatory cytokines TNF-α and IL-1β. Top left pane shows the nitrite concentration, top right pane shows the nitrate concentration, bottom left pane shows the combined reduced NO groups and bottom right shows the linear correlations of SNAP concentrations versus the concentration of measured NOx− species. (** p < 0.01 vs. negative control; *** p < 0.001 vs. negative control).

