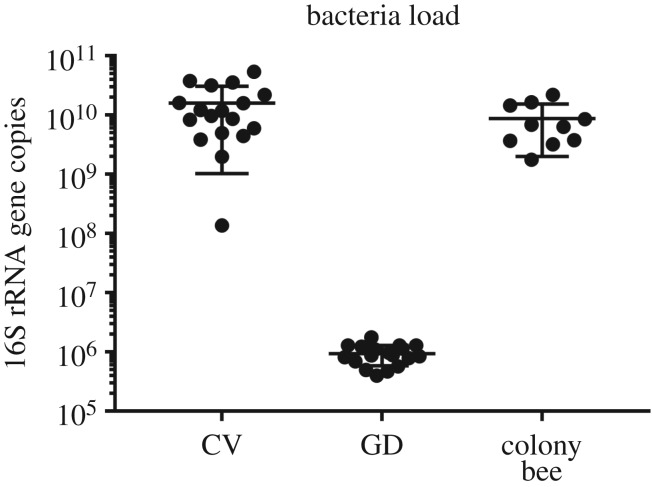
Figure 1.
The bacterial colonization levels in the guts of GD worker (n = 5 bees × 3 replicates), CV workers (n = 5 bees × 3 replicates) and colony bees (n = 10). For each boxplot, the centre line displays the median, + indicates expression mean, the boxes correspond to the 25th and 75th percentiles and whiskers span the 10th–90th percentile.

