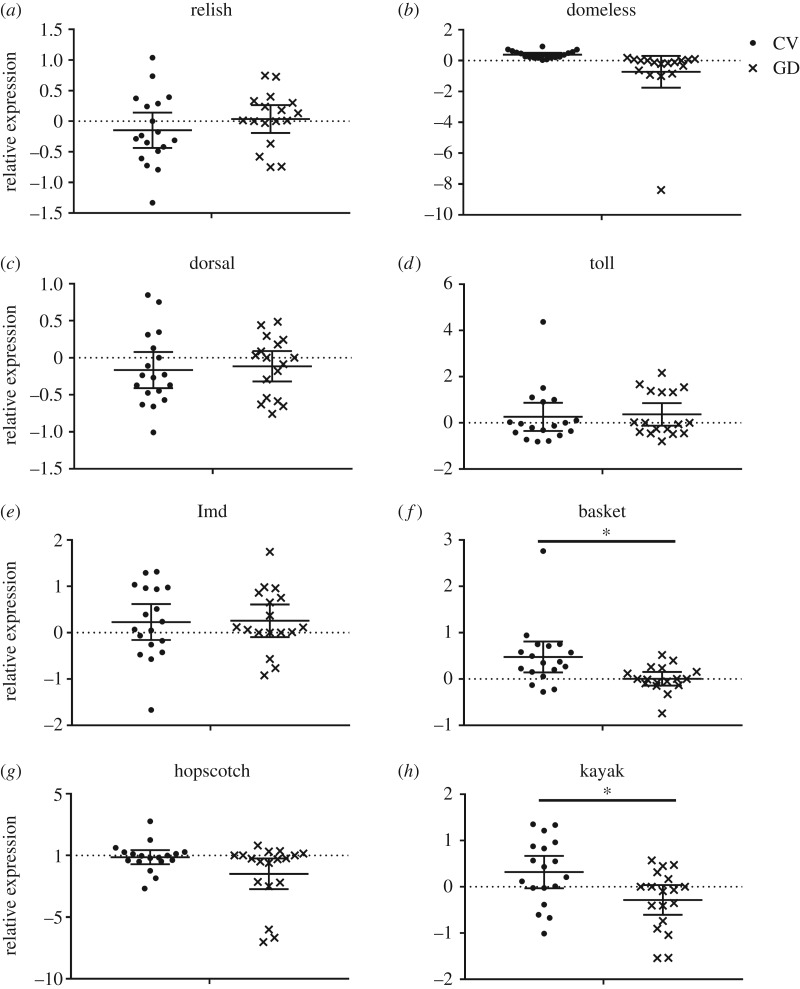
Figure 3.
The expression level of key immune components in the abdomen of GD worker (n = 6 bees × 3 replicates) and CV workers (n = 6 bees × 3 replicates). The relative expression was log2 transformed. Means ± 95 CI are shown by the black bars and whiskers. *represents the significant difference (p < 0.016).

